MIT App Inventor 2 & Highcharts data.csv configuration with RSSI and Distance Variables

Hey guys,

What's the proper way to output the Received RSSI Signal Strength and Distance Values (paired values) to a data.csv file and have the app update that file everytime with new signal values received?

This is part of my code blocks for making the RSSI signal output and Distance values to text:

And I need to create the file once and only update it every second.

Currently I only have these blocks:

Screenshot_21

I also have to take in consideration how the CSV file will be read by my chart:

-The first row of the CSV data is interpreted as series names
-The first column signifies category names or X values/dates
-Subsequent columns hold data values.

The Resulted output needs to be looking like this:

rssi-value-changes-by-distance

Hi Melody

Having created the file with SaveFile, you can stream data into it using AppendToFile.

1 Like

How can I check if the csv file gets created and its updated with the correct information ?

Also, this is how I currently have it and I have no idea if it works like this:

I take it that the CSV will be loaded/uploaded for use elsewhere, so you would know then. :grin:

What you could do is read the file back into your App - if it successfully converts into an App Inventor CSV table, all is good. If it fails, there will be an error message. If you include the Screen Error Message Block in your code, you can trap the message and use your own App logic to decide what happens next - maybe tell the User the file was empty or the structure of the content was faulty and optional display the content in a TextBox for manual edit.

Google recently made some Security Changes that prevent Apps on Android 10/11 from saving data anywhere other than the App's ASD (App Specific Directory). You can use Taifun's File Extension to create that Directory Path.

1 Like

That's the problem, I am dealing with two obstacles that make this very hard:

First, I don't know what path to set in Highcharts to read the said .csv when I test my App via the App Companion

Second, I don't know if the App even makes a .csv file at all

According to the documentation, this is how it should work but what I have done until now isn't for some reason.

At the moment isn't working and I don't have any idea why (also, their forums are bugged for me since I can't post there I am trying to find someone that understand the documentation implementation better than myself)

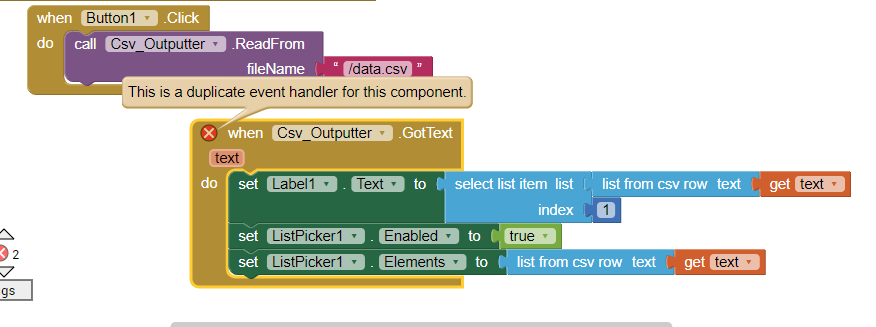
I also tested the chart locally, by manually creating a data.csv file and inputting the same values that should be inputed automatically in my app and it's also not working as well locally:

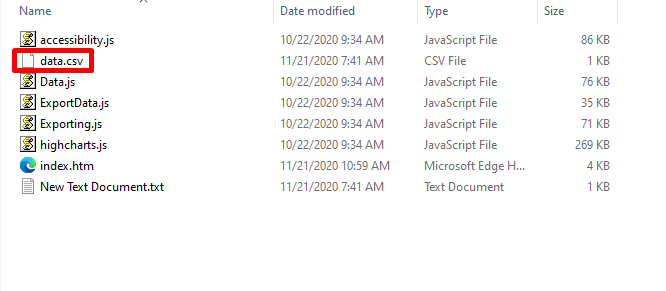
Contents of my Directory:

Screenshot_48

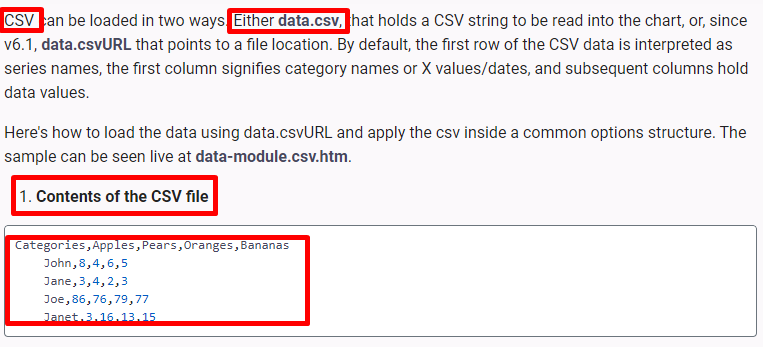
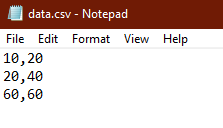
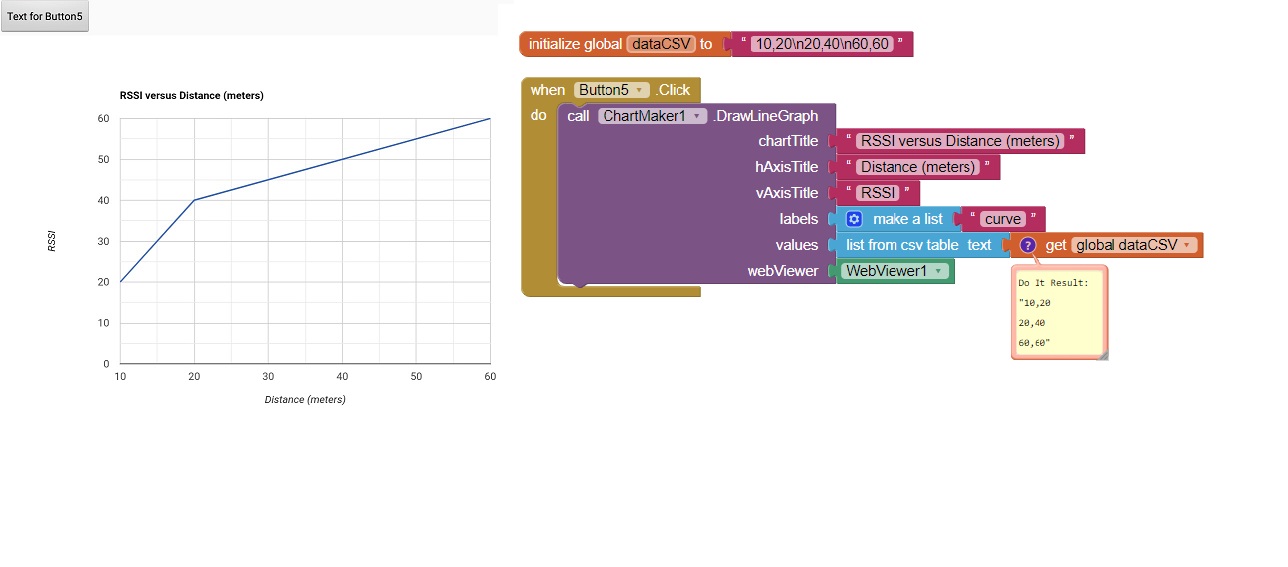
Contents of the Data.csv that I've manually created for testing locally:

Screenshot_49

My index.htm code:

<!DOCTYPE HTML>
<html>
	<head>
		<meta http-equiv="Content-Type" content="text/html; charset=utf-8">
		<meta name="viewport" content="width=device-width, initial-scale=1">
		<title>Highcharts Example</title>

		<style type="text/css">
.highcharts-figure, .highcharts-data-table table {
  min-width: 320px; 
  max-width: 800px;
  margin: 1em auto;
}

#container {
  height: 400px;
}

.highcharts-data-table table {
  font-family: Verdana, sans-serif;
  border-collapse: collapse;
  border: 1px solid #EBEBEB;
  margin: 10px auto;
  text-align: center;
  width: 100%;
  max-width: 500px;
}
.highcharts-data-table caption {
  padding: 1em 0;
  font-size: 1.2em;
  color: #555;
}
.highcharts-data-table th {
  font-weight: 600;
  padding: 0.5em;
}
.highcharts-data-table td, .highcharts-data-table th, .highcharts-data-table caption {
  padding: 0.5em;
}
.highcharts-data-table thead tr, .highcharts-data-table tr:nth-child(even) {
  background: #f8f8f8;
}
.highcharts-data-table tr:hover {
  background: #f1f7ff;
}

		</style>
	</head>
	<body>

<script> src="highcharts.js"</script>
<script> src="data.js"</script>
<script src="highcharts.js"></script>
<script type="text/javascript" src="themes/gray.js"></script>
<script src="exporting.js"></script>
<script src="export-data.js"></script>
<script src="accessibility.js"></script>

<figure class="highcharts-figure">
    <div id="container"></div>
    <p class="highcharts-description">
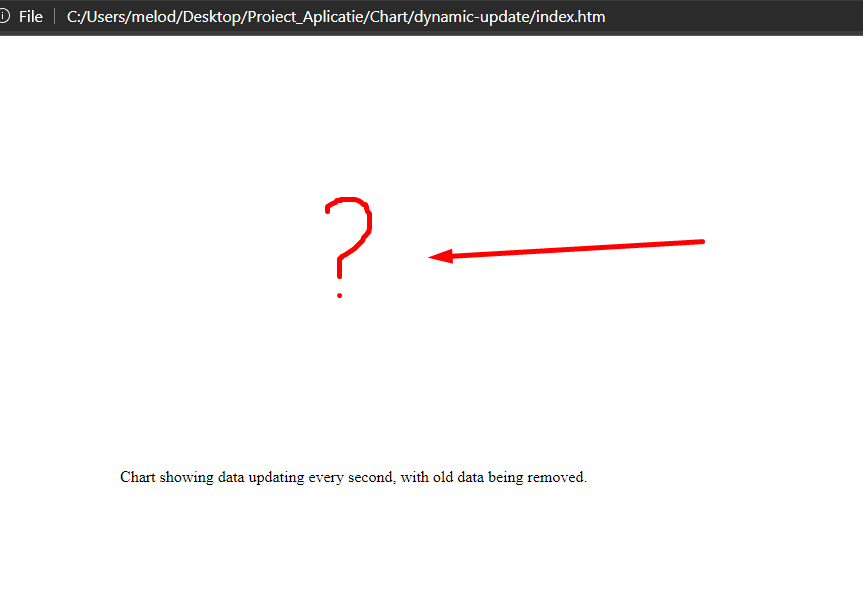
        Chart showing data updating every second, with old data being removed.
    </p>
</figure>


		<script type="text/javascript">
Highcharts.chart('container', {
    chart: {
        type: 'spline',
        animation: Highcharts.svg, // don't animate in old IE
        marginRight: 10,
        events: {
            load: function () {

                // set up the updating of the chart each second
                var series = this.series[0];
                setInterval(function () {
                    var x = (new Date()).getTime(), // current time
                        y = Math.random();
                    series.addPoint([x, y], true, true);
                }, 1000);
            }
        }
    },

    time: {
        useUTC: false
    },

    title: {
        text: 'Live random data'
    },

    accessibility: {
        announceNewData: {
            enabled: true,
            minAnnounceInterval: 15000,
            announcementFormatter: function (allSeries, newSeries, newPoint) {
                if (newPoint) {
                    return 'New point added. Value: ' + newPoint.y;
                }
                return false;
            }
        }
    },

    xAxis: {
        type: 'datetime',
        tickPixelInterval: 150
    },

    yAxis: {
        title: {
            text: 'Value'
        },
        plotLines: [{
            value: 0,
            width: 1,
            color: '#808080'
        }]
    },

    tooltip: {
        headerFormat: '<b>{series.name}</b><br/>',
        pointFormat: '{point.x:%Y-%m-%d %H:%M:%S}<br/>{point.y:.2f}'
    },

    legend: {
        enabled: false
    },

    exporting: {
        enabled: false
    },

    series: [{

        name: 'Random data',

$.get('data.csv', function (data) {

 // generate an array of random data
            var data = [],
                time = (new Date()).getTime(),
                i;

            for (i = -19; i <= 0; i += 1) {
                data.push({
                    x: time + i * 1000,
                    y: Math.random()
                });
            }
            return data;
        }())
    }]
});
		</script>
	</body>
</html>

The code I added in the index.htm file to read the data.csv locally is this:

$.get('data.csv', function (data) {

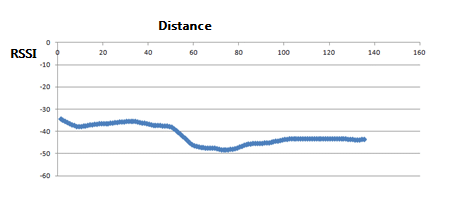
Resulted Chart shows as empty so it's not working:

I tried to see if the blocks work in the App but it won't let me either:

I would try to follow the csv string option and pass the csv table to the webviewer in the WebViewString property, see also How does the property Webviewer.WebViewString work?

I currently don't know, if the webviewer is able to read a csv file during runtime of the app...

Taifun


Trying to push the limits! Snippets, Tutorials and Extensions from Pura Vida Apps by icon24 Taifun.

1 Like

Sorry to see you still struggling. Are you sure data.csv is a csv file?

The following example works using ChartMaker

1 Like

The indication is good but it is clearly aimed towards someone with a pretty soldid html coding experience which I don't have.

Could you please let me know what do I write in the index.htm and what would the code and the path look like when using your method?

I am asking because there isn't any documentation for this, I keep reading hundreds of pages with no success in finding the right path to make this work.

Just a glimpse on how my tabs look like for the last 3 days, I really struggle to find a way to make it work and it's so frustrating it that doesn't want to work after trying what I've read in the documentation and here.

And the irony is that if I only knew what few lines of code to add I would have this work but those few lines of code seem nowhere to be found.

see the lastest tutorial by @ABG here, which also uses the new path to the html file, which is http://localhost/yourFile.html

Taifun

I just want to make a data.csv file from the input the app gets from my esp32 and have it updated with that input.

I do not need and I do not want another javascript because I have all the javascript I need already offered by Highcharts.

I already did the blocks and it's not working for whatever reason and I'd like to know what is wrong in my blocks that's all and what I need to modify. If there is a way to share my entire project in here let me know, maybe someone can look at it and let me know where I messed up.

The app only needs to create a file named data.csv and update it live each second with new data that it gets as text input from my esp32 so that my highcharts graph can read the contents of the data.csv file and update live based on the values.

My values inside the csv file should look like this:

-4,2
-12,4
-7,3

First one representing the RSSI value and the second being the estimated Distance value, these are already being sent exacly like that from my esp32 to the Mit 2 App, I just need to put them inside a csv file called data.csv and have that file being updated with whatever new values it gets from the esp32 constantly.

After that I need the right filepath and code for the filepath so that I can add it into the index.htm file that highcharts use.

Example: get.data.csv from x/y location in Mit App 2, wth x being used before compiling the app into an apk and y being used ater the apk is compiled.

as already mentioned earlier I'm not sure, if the webviewer is able to access the file system to read your csv file, therefore I suggested to follow the other method...
probably someone else can confirm this...

Taifun

Taifun

1 Like

probably the custom webviewer extension is able to read your csv file?

the author of that extension @vknow360 might be able to answer that question...

Taifun

1 Like

I simply created a new text document, named it data, added those values inside and saved it with the .csv file format.

My questions are:

-Is that Chart animated?
-Can it display spline instead of line?
-Does it support zoom function via touch pitch with fingers?
-Does it support a button for saving screenshots?

Can it be made to look like this? (in terms of theme colors only) because your arrangement is perfect.

https://www.highcharts.com/demo/live-data/dark-unica

I also HATE the way it animates itself for a second then it stops, it feels like it's lagging so I want continuous animation.

If ChartMaker can do all of that out of the box like you showned via those blocks, then I see no reason to continue venturing on implementing highcharts which is a nightmare.

The only reason I wanted to use highcharts was because I don't know if ChartMaker is animated and dynamic and has themes.

I need a Dark theme and a normal theme like the one you used because my app will have a dark mode that when used will switch the chart to that look from the link I sent.

I also need to have it work on a second screen that turns into landscape mode that you get redirected to automatically after connecting to the other bluetooth device.

The chart will then be in full screen and in landscape mode in that second screen until the user goes back to the first screen, where the connect button will now turn into a "Disconnect" button.

After that I'd like to have the entire App capable of running into a "minimised mode" if the upper arrow is pressed, the upper arrow will appear after connection.

When minimised at the bottom, the app will display the distance and rssi strength in text.

Animation will look something like this (but that is for after I'm done with this):

But that is a subject for another thread :sweat_smile:

  • Is that Chart animated? What does animated mean to you? The ChartMaker app can be updated every 500 ms or less with a little flicker using a Clock. No app that relies on an Internet connection can update a chart in real time without some flicker.

  • Can it display spline instead of line? No. If data points are close enough and many, who cares?

  • Does it support zoom function via touch pitch with fingers? No

  • Does it support a button for saving screenshots? No. There is an extension that will do that.

  • Can it be made to look like this? (in terms of theme colors only) because your arrangement is perfect. No. It looks like it looks.

  • I need a Dark theme and a normal theme like the one you used because my app will have a dark mode that when used will switch the chart to that look from the link I sent. You can have a dark theme, however the chart itself will look like it looks.

  • I also need to have it work on a second screen that turns into landscape mode that you get redirected to automatically after connecting to the other bluetooth device. Using existing extensions, you lose the BT connection when switching screens.

  • The chart will then be in full screen and in landscape mode in that second screen until the user goes back to the first screen, where the connect button will now turn into a "Disconnect" button. You probably can code that.

ChartMaker makes some parts of your app very simple to code.

This means is if you require all those features, you need to use Highcharts and learn to code html in order to code your perfect app.

At the present, you cannot apparently get even a example app to work with Highcharts. Dream about what you want but the reality is you need to get the basic app to work. Isn't that true? Create an example showing how you are trying to use Highcharts and enclose a data.csv file and aia. Someone might experiment and provide advice.

Can you demonstrate the the data.csv you capture is a csv? see Live Development, Testing, and Debugging Tools

You probably do NOT need to save a csv file. You can create a List or csv from your data flow and use that without using the File component to save it since you are creating the chart live.

You asked about sharing your code with the forum. Do that by posting an image of all your blocks or posting an aia file. Someone with a wsp32 might be able to test it.

I was able to get both examples working inside my app for both Highcharts and Chart.js my dear.

Chart.js example running inside my app:

Highcharts example running inside my app:

I decided to use Highcharts because of their accesibility in terms of source files. The problem is the example is not using a local data.csv. It's using a math functions that generates random values. The other examples they provide are using csv either from inside the javascript or html either from a url.

Their documentation does not provide any examples using a local dynamic data.csv file.
They only mention that it can do that but not showing how to exactly.

My app does not require an internet connection, neither the chart itself., that is the reason I want to use a local dynamic data.csv so that it works offline as it should.
I see no purpose in running such an app online other than comparing stored data with others or using Google maps api to show the locations of the devices on map, which would be pointless considering the distance the devices operate at is aprx. under 20 meters away from each other due to Bluetooth's low signal range.

I don't plan to implement any of these possible online features at this time simply because I don't need them, neither do I need any user database or accounts storage at this very moment.

but not with a dataset generated by your esp32. So learn to code html and access it with a WebViewer.

1 Like

You can probably use the webviewstring to feed the data into your script in the html file.