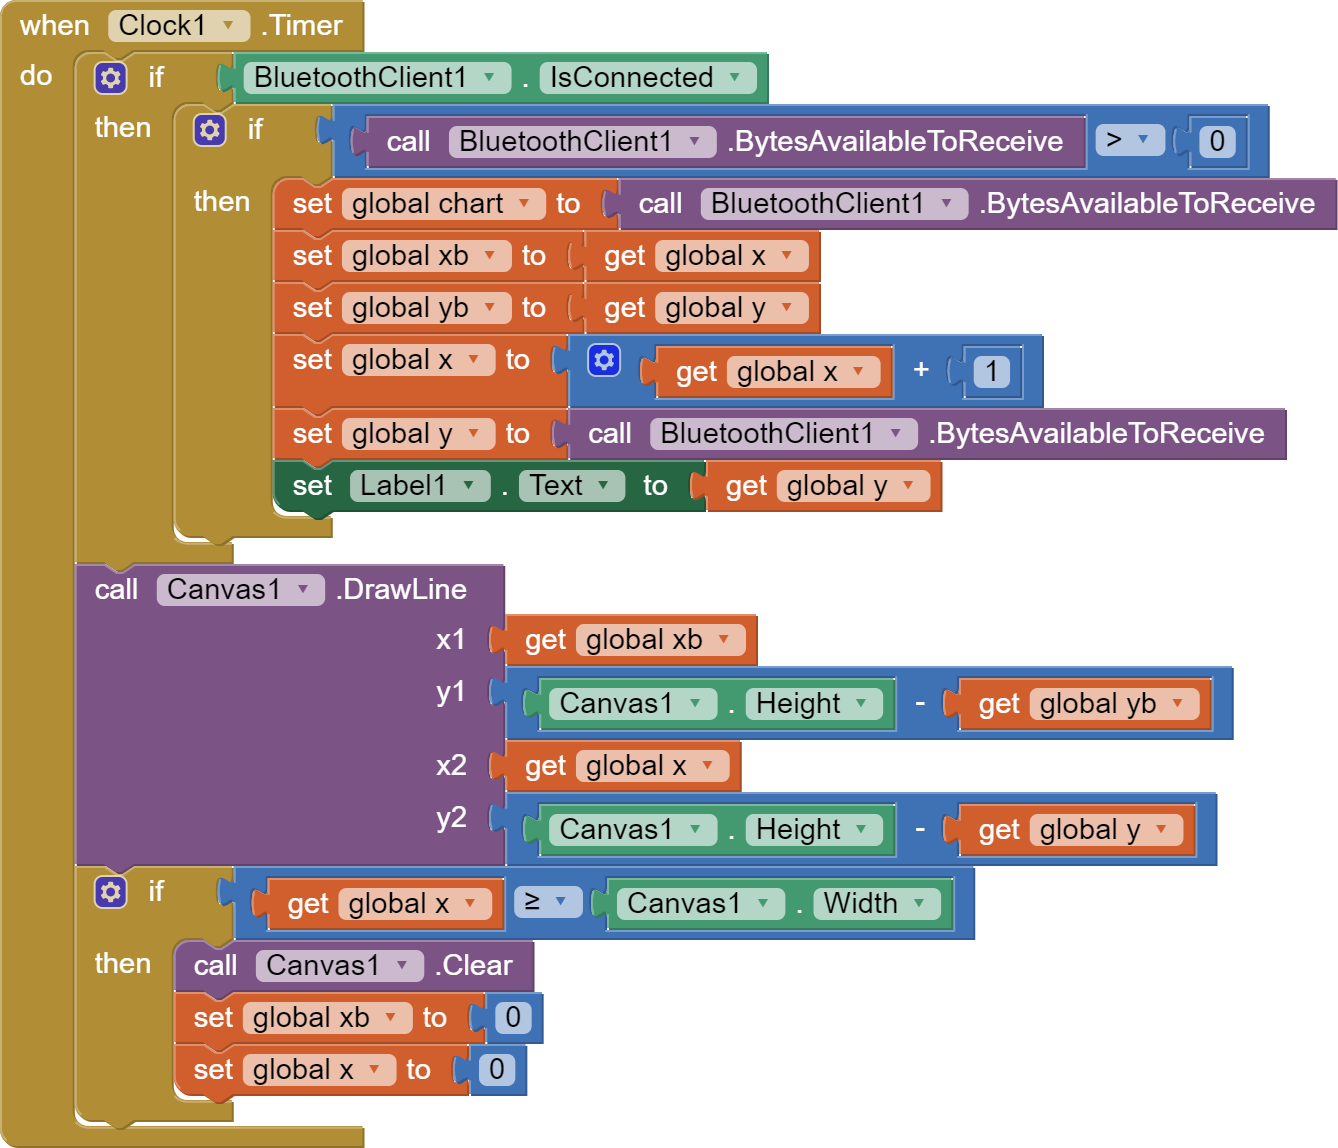
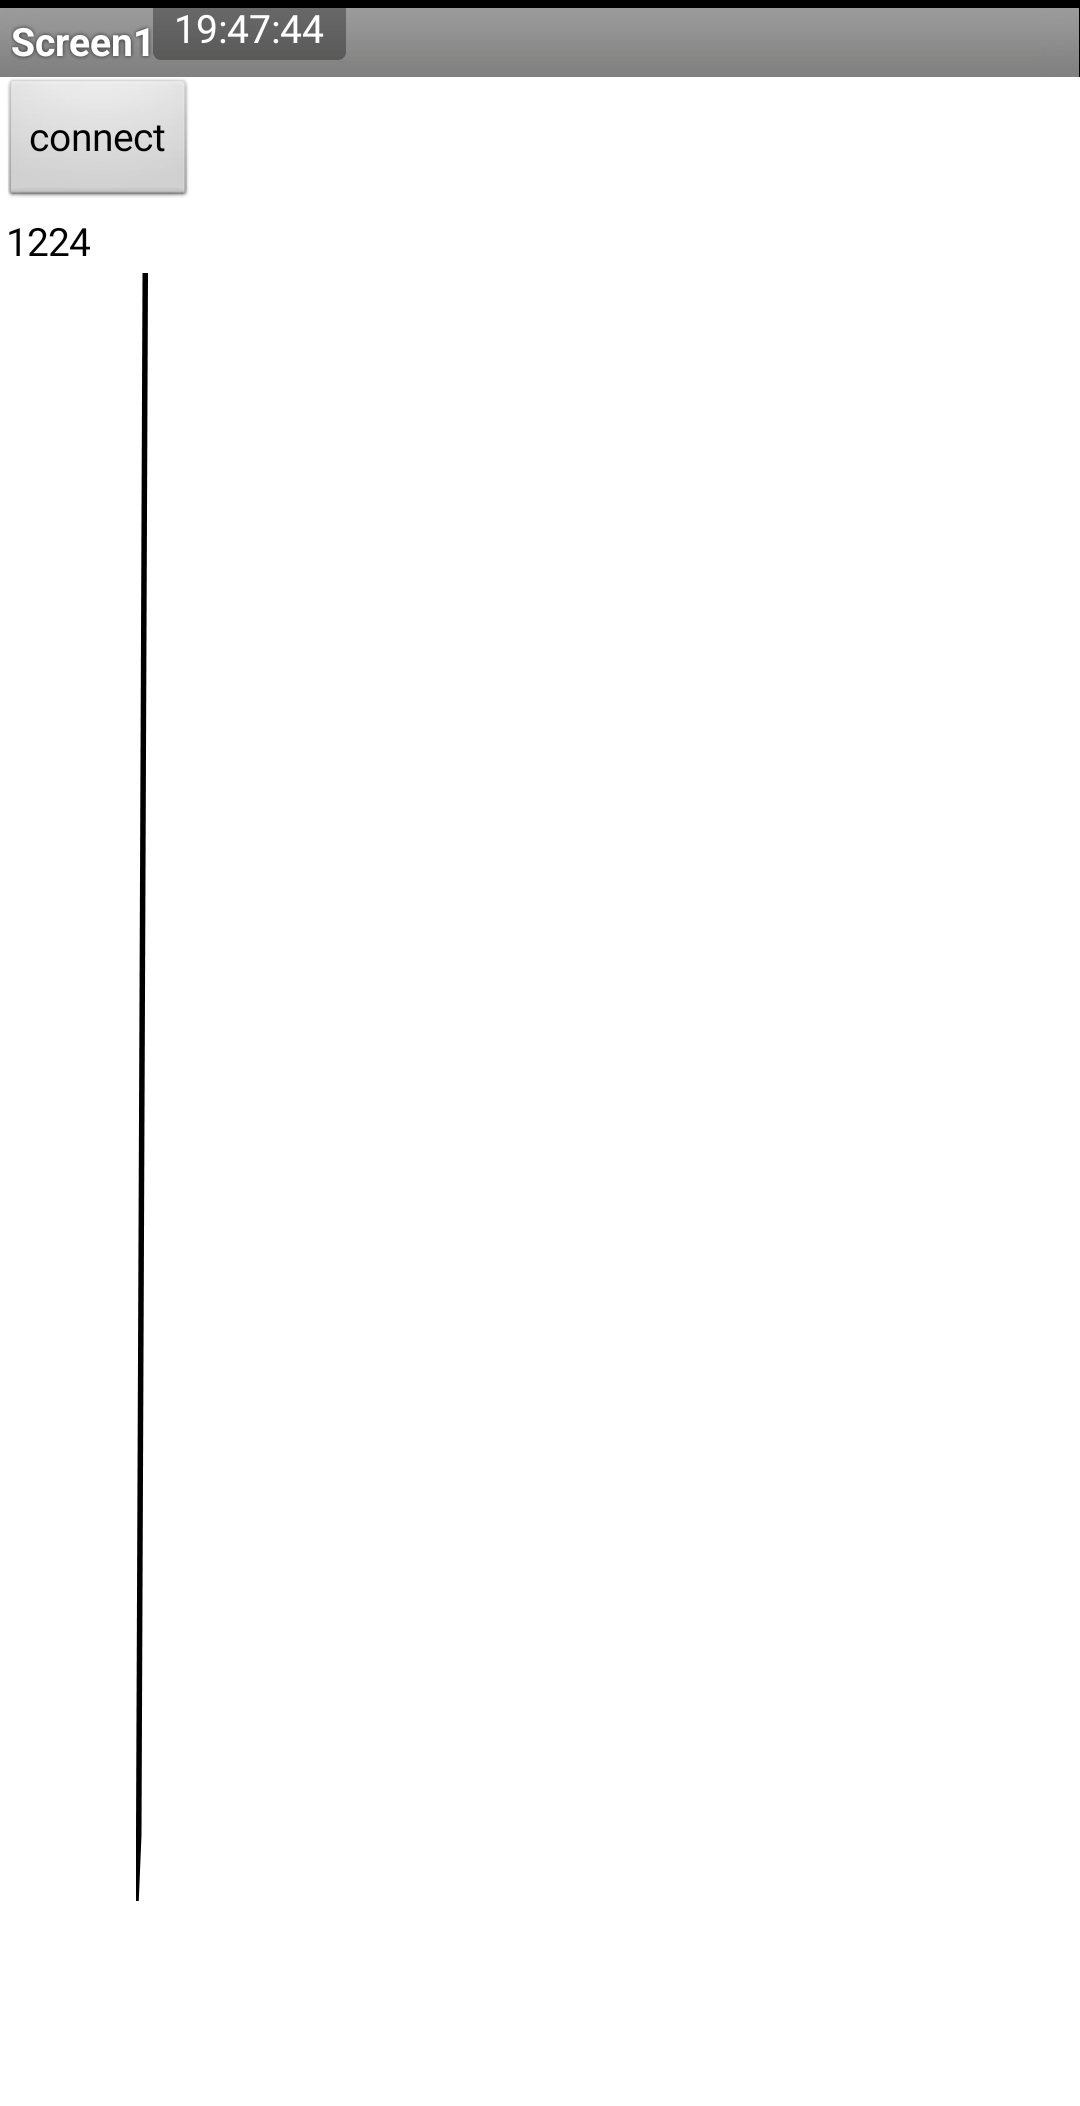
I tried to make a graph with canvas but I'm getting this results
And I'm using this blocs
BytesAvailabletoReceive tells you how MANY bytes are waiting in the input buffer.
It does not give you the actual incoming data.
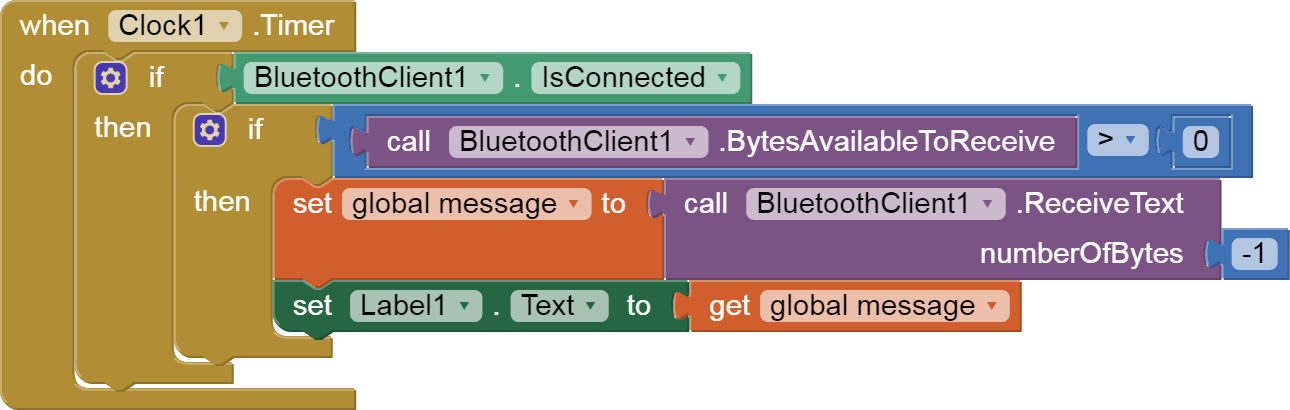
Do a ReceiveText to get the incoming data, and show it in a Label.text to know what to do with it next.
It would also help to show the sketch that is sending the data, to make sure both sides are talking the same language.
I didn't understand that much
Could you show it to me how to do it in blocks
This is the native AI2 Chart component's BlueTooth data feed ...
More Charts samples are at
To receive BlueTooth data for your own purposes,
here are some standard samples ...
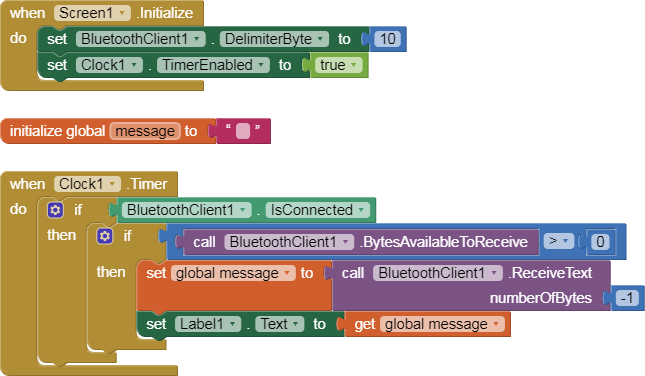
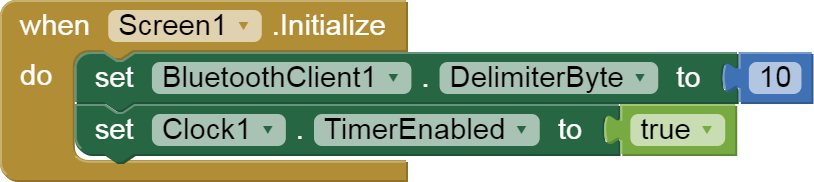
Here is a simple BlueTooth text receiver sample, for single value per line:

I recommend getting that working first, before going on to trying to graph the data.