Hi! I'm just getting started with MIT App Inventor, and I'm curious if there is a way to have an interactive graph. For context, I'm making an app to track hours a brace has been worn (for scoliosis). When you click on a point on the graph, can you have another page pop up with more information on what happened on that specific day? I think it would be great if I could click on a day in the graph and see exactly what hours in the day the brace was worn. Thanks!
looks like it is a calendar app.
1 Like
And what type of backend are you ussing? (As database) (Sql, Graph, Documents, Postrgres, etc.)
For the simplest record keeping, I would keep a TinyDB instance with Clock1.SystemTime as tag values for when the brace was put on, and 0 or Clock1.SystemTime of when the brace was removed as values (ms from 1970).
This organization uses one TinyDB entry per time span, and allows for easy filtering of a TinyDB TagList by dateTime range.
The last entry in the TagList tells you if the brace is currently on (0 value) or off (non-zero value.)
You might need to consider user error in recording on/off times, and provide a ListView to browse on/off records, and a pair of Date/Time Pickers to update or add missing or incomplete entries.
I do not know how the data is entered (recording the date and hours of the orthopedic device and its use), but take into account that the month has 31 days and a day has 24 hours.
What I'm getting at is that this graph (on the phone) will have very little "resolution", just think that a bar graph should have 31 bars, where the best order would be for the 31 days to be vertical and the hours to be horizontal, so you can scroll from top to bottom (days) and from left to right (number of hours). But this will also depend on the number of devices you are monitoring (1....15...1897).
I would think more about which value matters the most [hierarchy; (device > days > hours)].
Ej:
- Yes, they must pay me for the use of the devices.
I'm more interested in knowing how many hours "device x" was used, and if you ask for details, click on "device x"
and show me the details of what days and what time it was used (in the month to be billed).
- Now, if it is for scientific purposes.
Everything will depend on where the study is directed, where in that case, it is important that you have the graph in all its views x= hrs y= days (and vice versa), etc.
Thanks so much everyone for your thoughts. @ABG can you please explain more about how this would work? If I wanted to use a physical temperature gauge, would it still work? I'm going to buy a micro bit and am hoping that I will be able to collect information about the current temperature and be alerted when that drops or suddenly peaks (i.e. user puts on their brace, temperature increases). The hope would be that that information is stored and can be used to create graphs of hours worn (similar to Fitbit's tracking of hours slept based on heart rate).
1 Like
Yes, @Jonathan_Urbina1 that's exactly what I'm thinking. I think the easiest way to go about it is to simply display a list of the dates and the number of hours worn. Then, when you click on a day, you get more detailed information about the times it was worn from/to, etc. Do you have any suggestions on how to go about coding something like this? I am very new to MIT app inventor and app design in general.
1 Like
From what I read above, I see that you want to monitor vital signs and stuff, so before programming, it is better to take into account certain things such as:
-
If it is real-time monitoring you must take into account the ranges you will manage; 35~38 Cº is a normal temperature range for humans, especially if they are exercising or are lethargic.
-
I don't think TinyDB (for these cases) is a good way to store data, because "it only works if the application is in use". Just like any other method on the device (Sql, etc). Because they will only do it if the App is in use.
- That's why (I think it's convenient) to use some cloud service, such as FireBase or Supabase (even the 2 together would be much better).
- Taking into account what I just told you, you could use some kind of ESP32 (something small and reliable), connect it to the network and have it send the data to the server, then, from your app, bring the data from the server and use it as you please.
-
It would be convenient to use its physical interrupt ports as triggers to activate and deactivate; So you don't need to have them on all the time (consuming battery and filling the database with unnecessary data).
-
At the end of the day... you just need to know what time they used it and stopped using it, then when: Port 2 receives
35 Cº(or more, but less than 38 Cº), it activates [and sends TRUE to the server] and when it drops below that temperature it deactivates [and sends FALSE to the server]. Since more than 38 Cº implies that there is something wrong that is not working well (they left it in the sun, etc.) -
That TRUE and FALSE can be accompanied by a value of type TIMESTAMP in the database, where you would have a calculated field that takes the difference between one and the other.
-
To program the ESP32 or whatever you are going to use, I recommend NODE-RED and its plugin BLOCKLY, they will make your life much easier. And as for storage, I recommend Supabase (It has a better free plan and is packed with features that handle any type of data [GIS, Vector, etc]), Firebase is good, but expensive and full of hidden expenses.
-
Going back to what the mobile device (App) is, you only need a UI that you could do it dynamically with the extensions; Dynamic Components, View Pager and a few other things (Labels, etc.), then you would only need the WEB component to make the calls to the DB to bring you the requested data. Which I don't think will be requested every day, but weekly, biweekly or monthly [Depending on the agreement you have with the clinics].
-
Your database should be divided into:
- Table/Document: Devices [ESP32]
- Table/Document: Clinics/Clients
- Table/Document: Data/Records [Fields:
Client_id,Divice_id,Date,hr_Ini,hr_End,Qnt_hr,Billed] = {10, 58, 04/11/2024, 1712808789, 1712812389, 1, No}
- That way you can do query functions like:
- Give me the total number of hours that equipment 58 was used in the period between "this date" and "this other date" (regardless of the client)
- Give me the total hours between "this date" and "this other date" for all the devices that client 10 has.
- Give me the total hours between "this date" and "this other date" for device 58 but only for client 10
- Etc.
-
The rest would be just paraphernalia of graphs and other things [if we go to the point, they will only be useful to you, to the point of not knowing if it is necessary to get into graphs and dashboards, taking into account that you are a beginner].
-
But if you really want to learn [and not just get things done], I'll gladly help you and teach you what I know.
-
If you don't even know where to start, tell me, so we start from scratch and add/remove things over the course of learning.
Hardware solutions are beyond me.
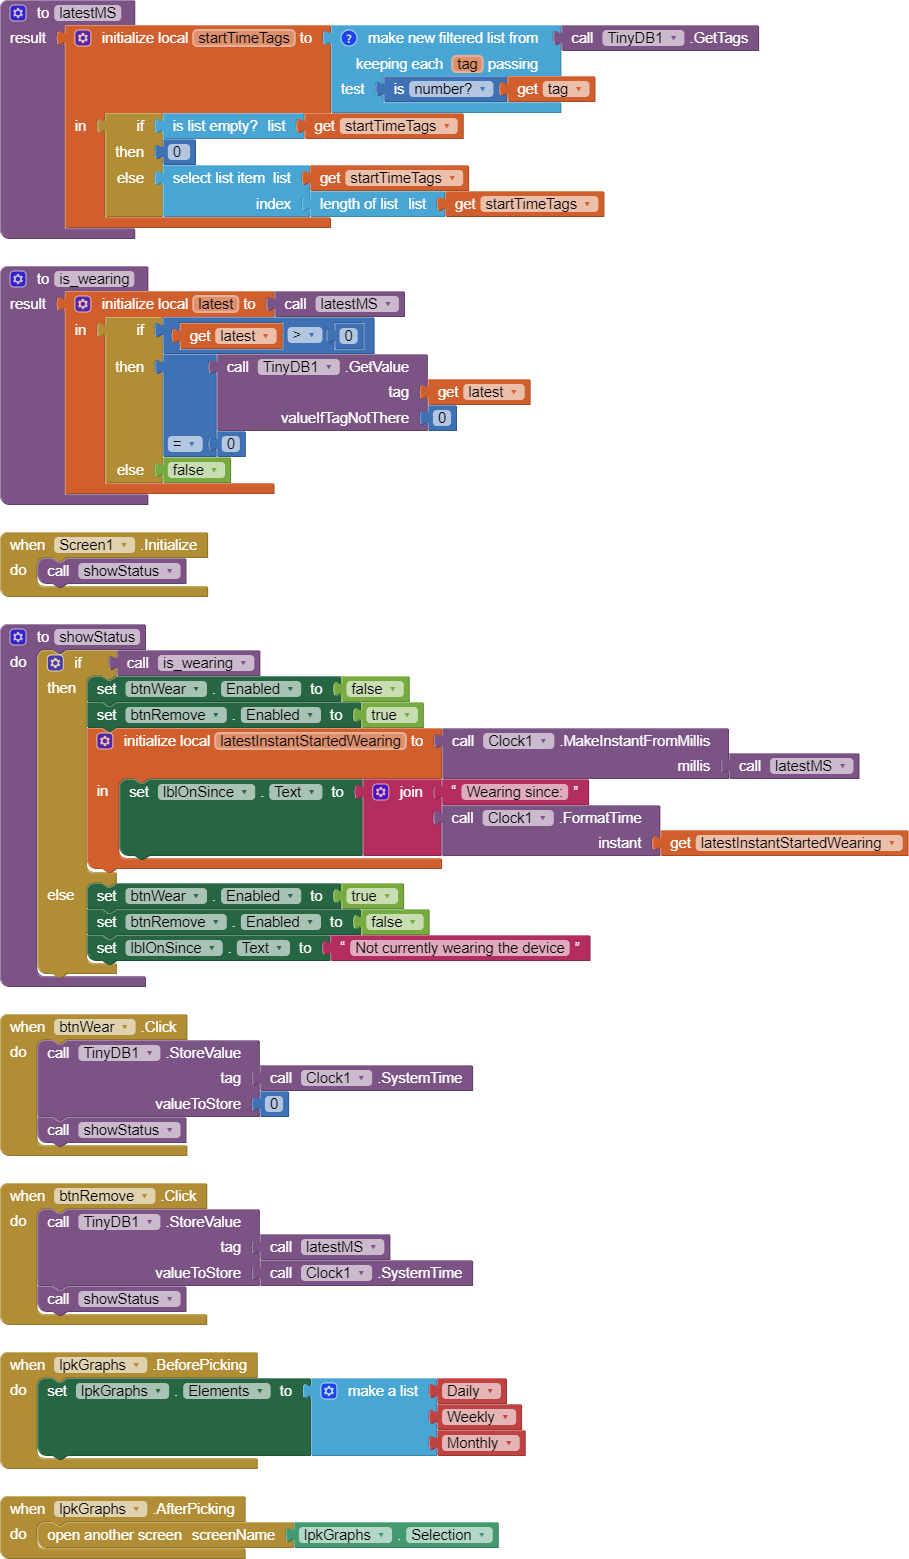
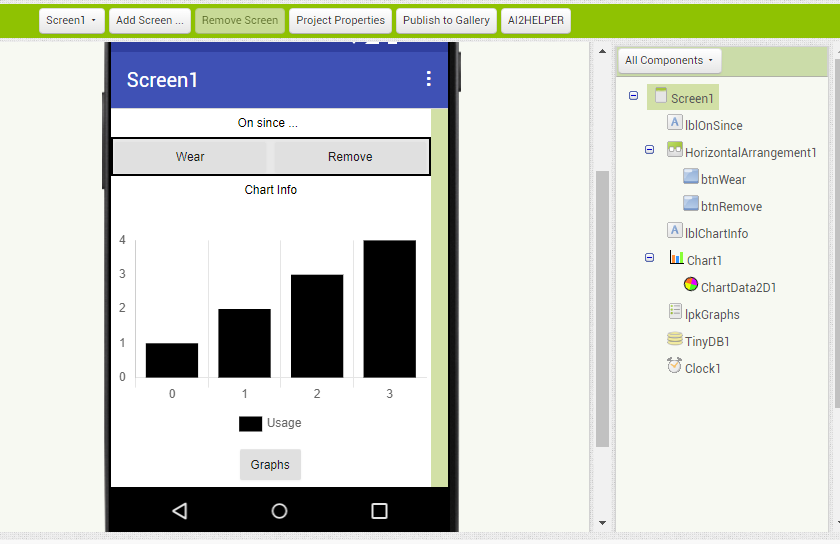
If you want a simple honor system app to accumulate usage time spans, here is a starter app for you.
It does not include transformational logic needed to convert time spans to daily and hourly usage buckets for graphs. That can come later.
on_off_times.aia (5.6 KB)
1 Like
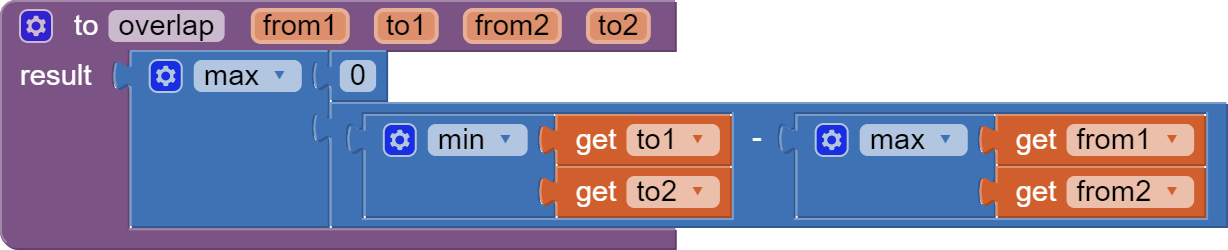
Here's a daily usage graph, with the reusable procedure to take time spans and fill buckets from them.
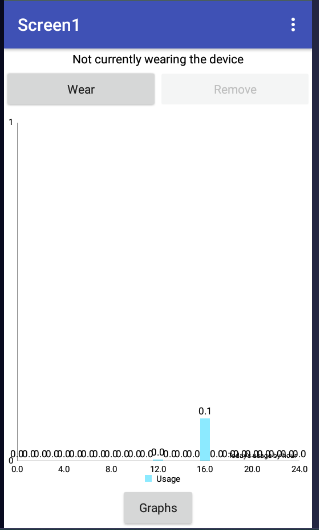
The bar graph would look less crappy once more data was added.
on_off_times.aia (7.1 KB)
1 Like
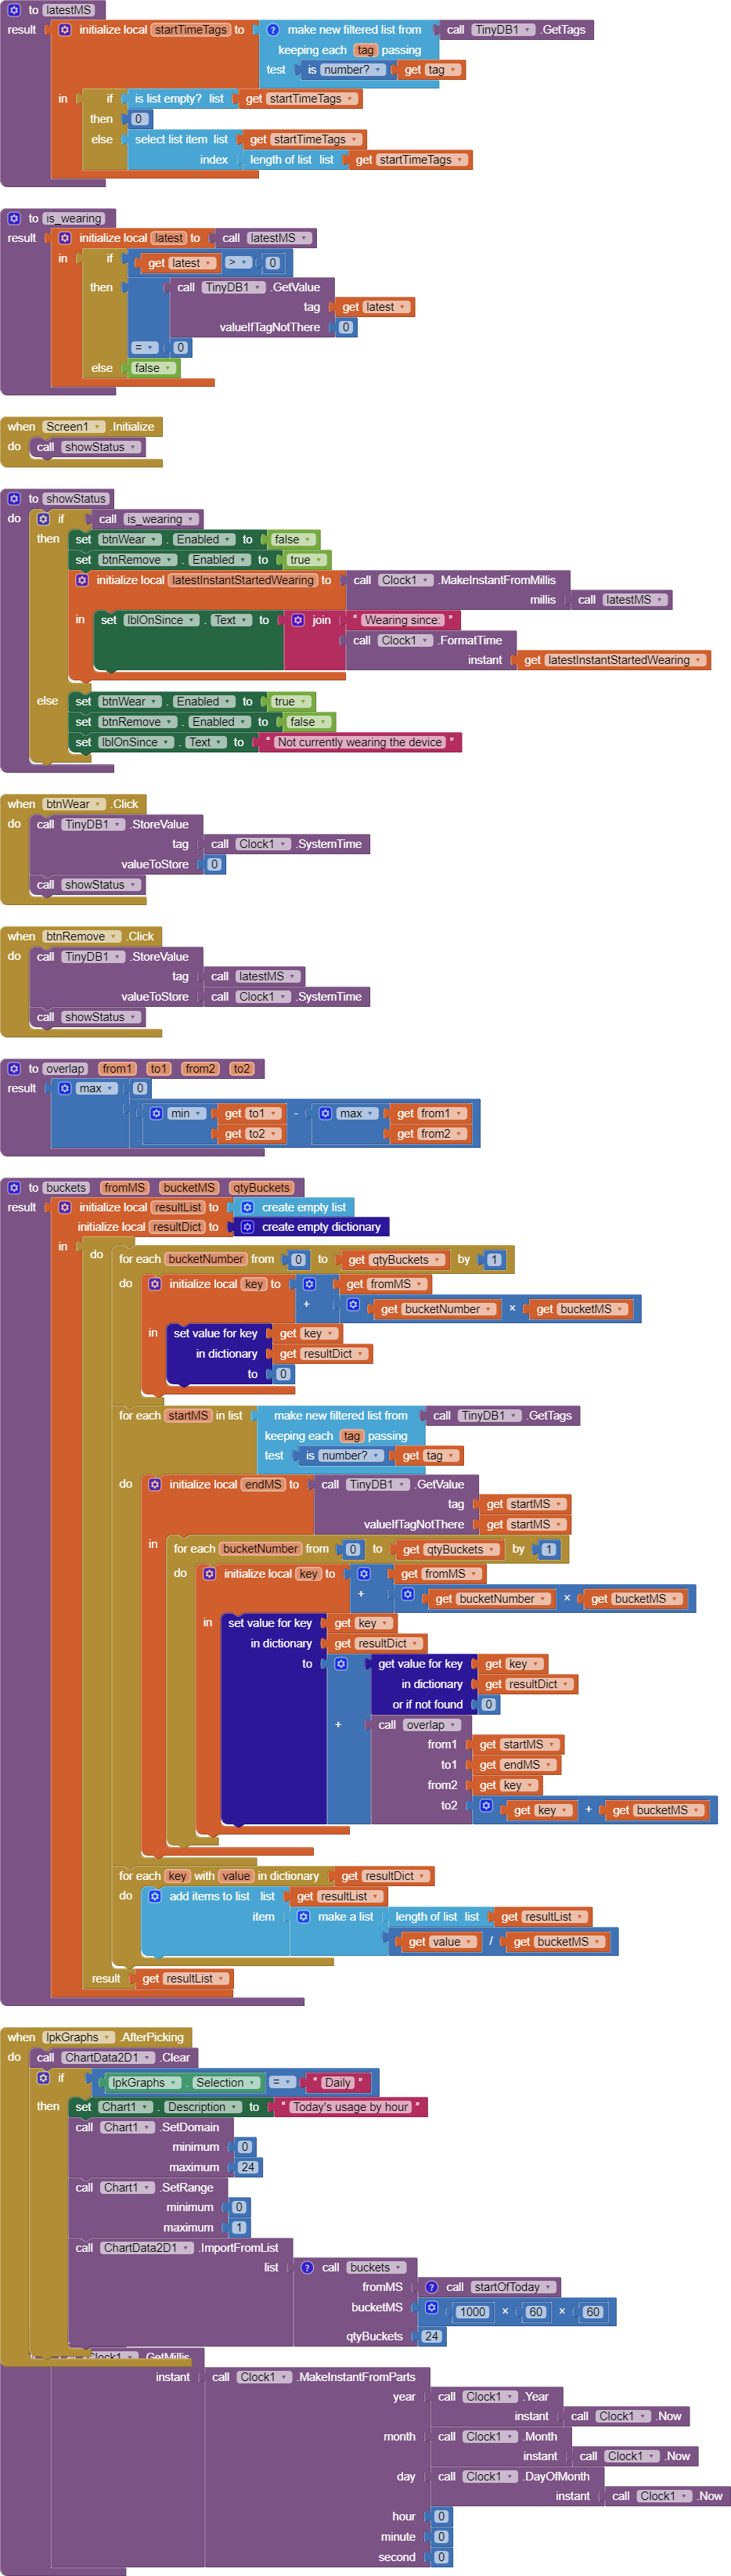
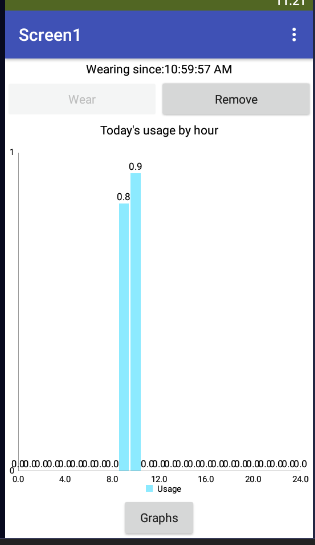
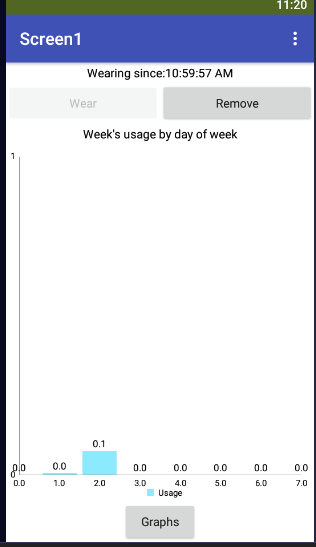
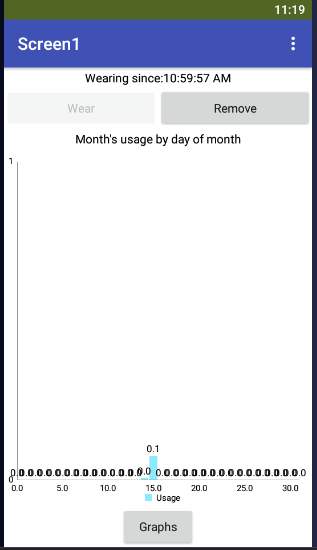
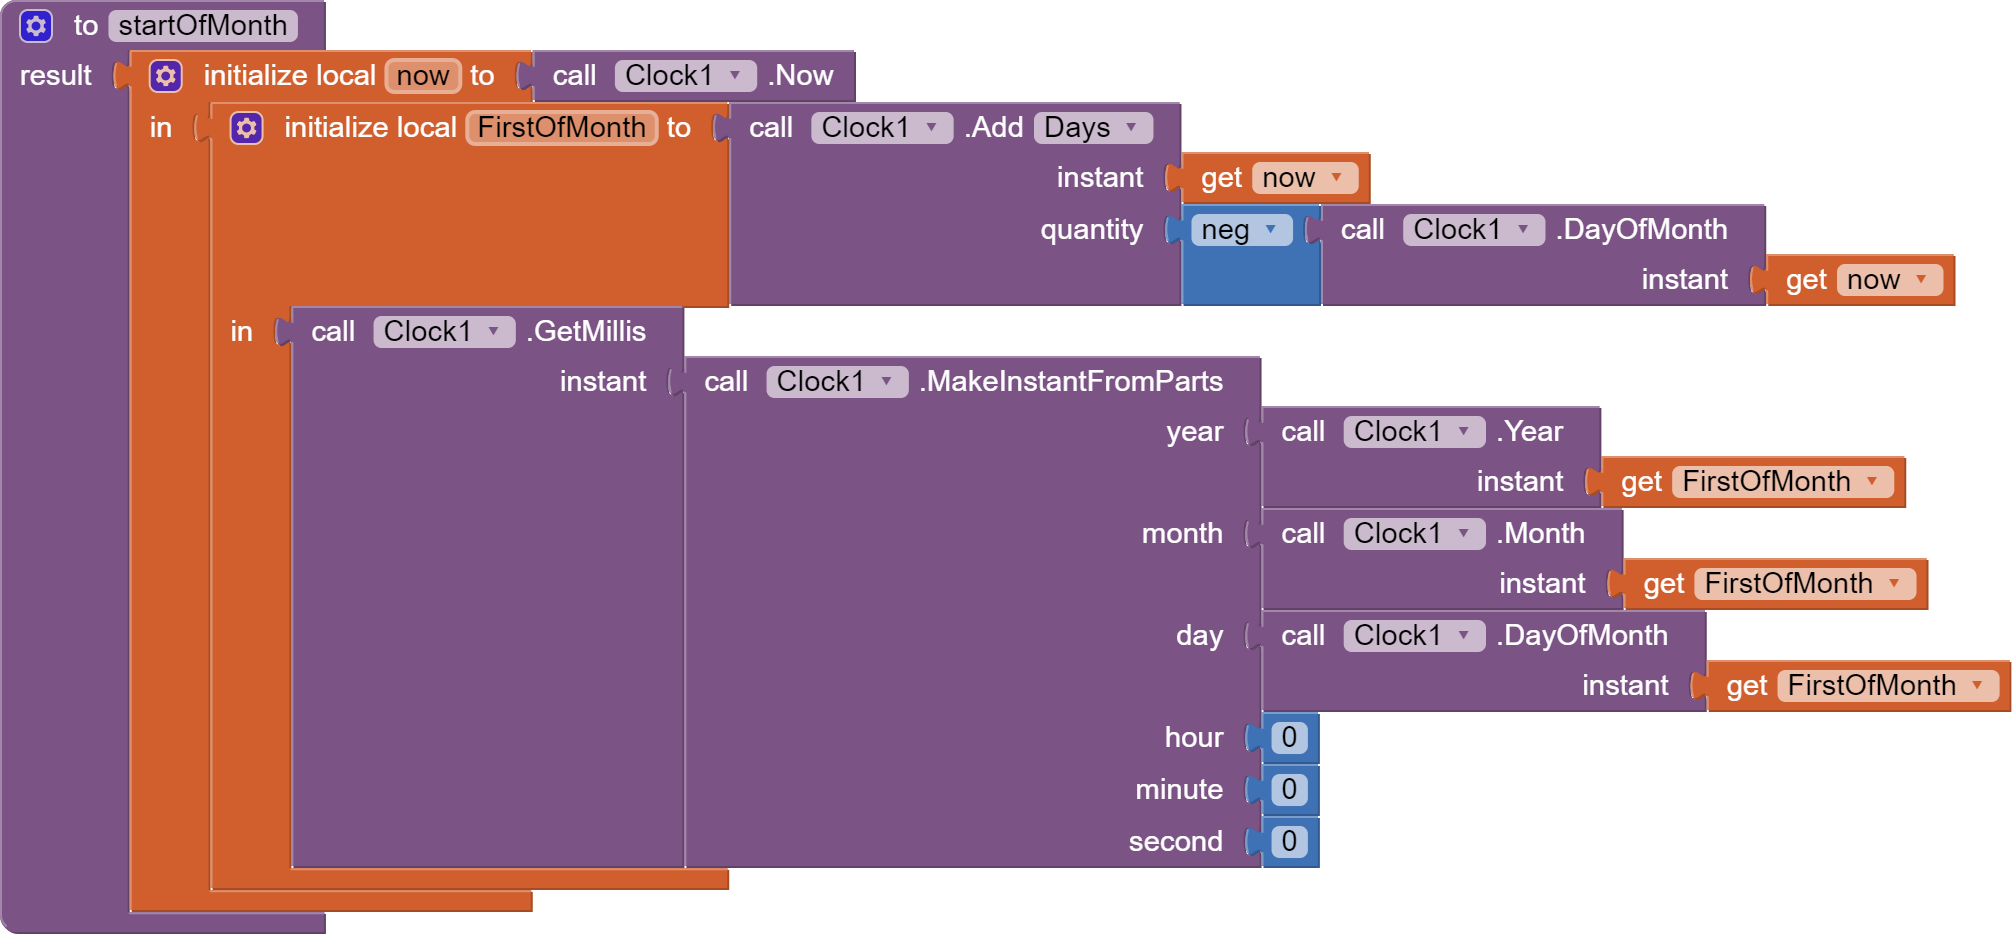
To show the generality of the time spans to buckets conversion, I added Weekly and Monthly bar graphs, and a Label tweak to bypass the unfortunate Bar Graph Description positioning.
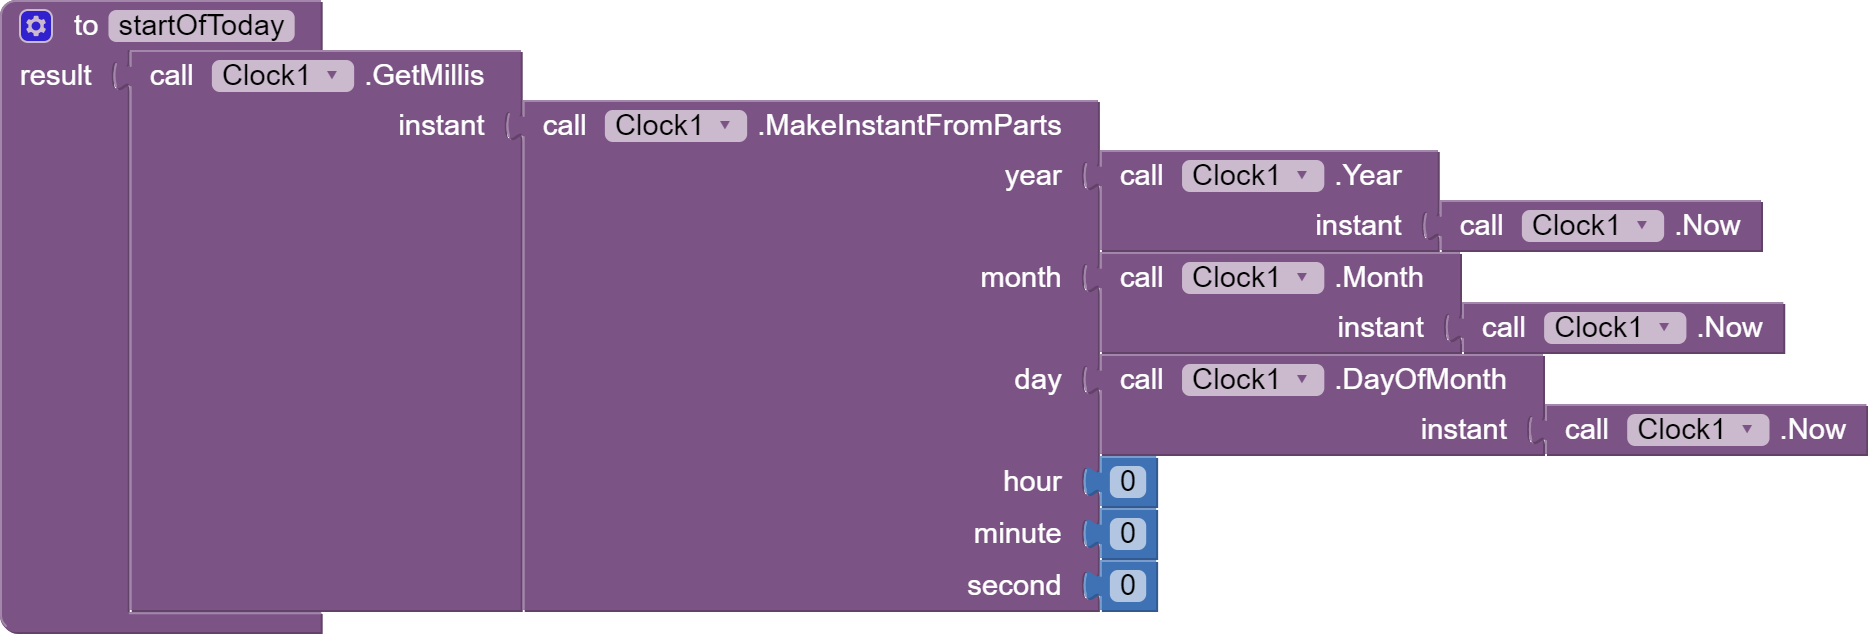
Daily Usage:
Weekly Usage:
Monthly Usage:
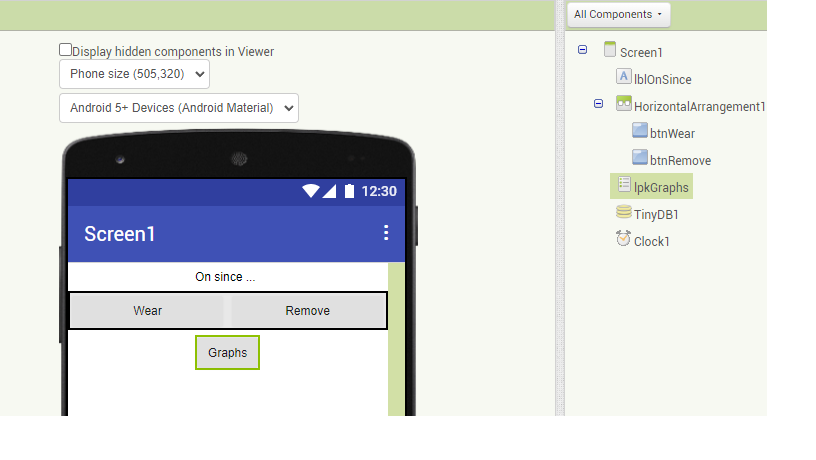
Designer:
Export:
on_off_times.aia (8.9 KB)
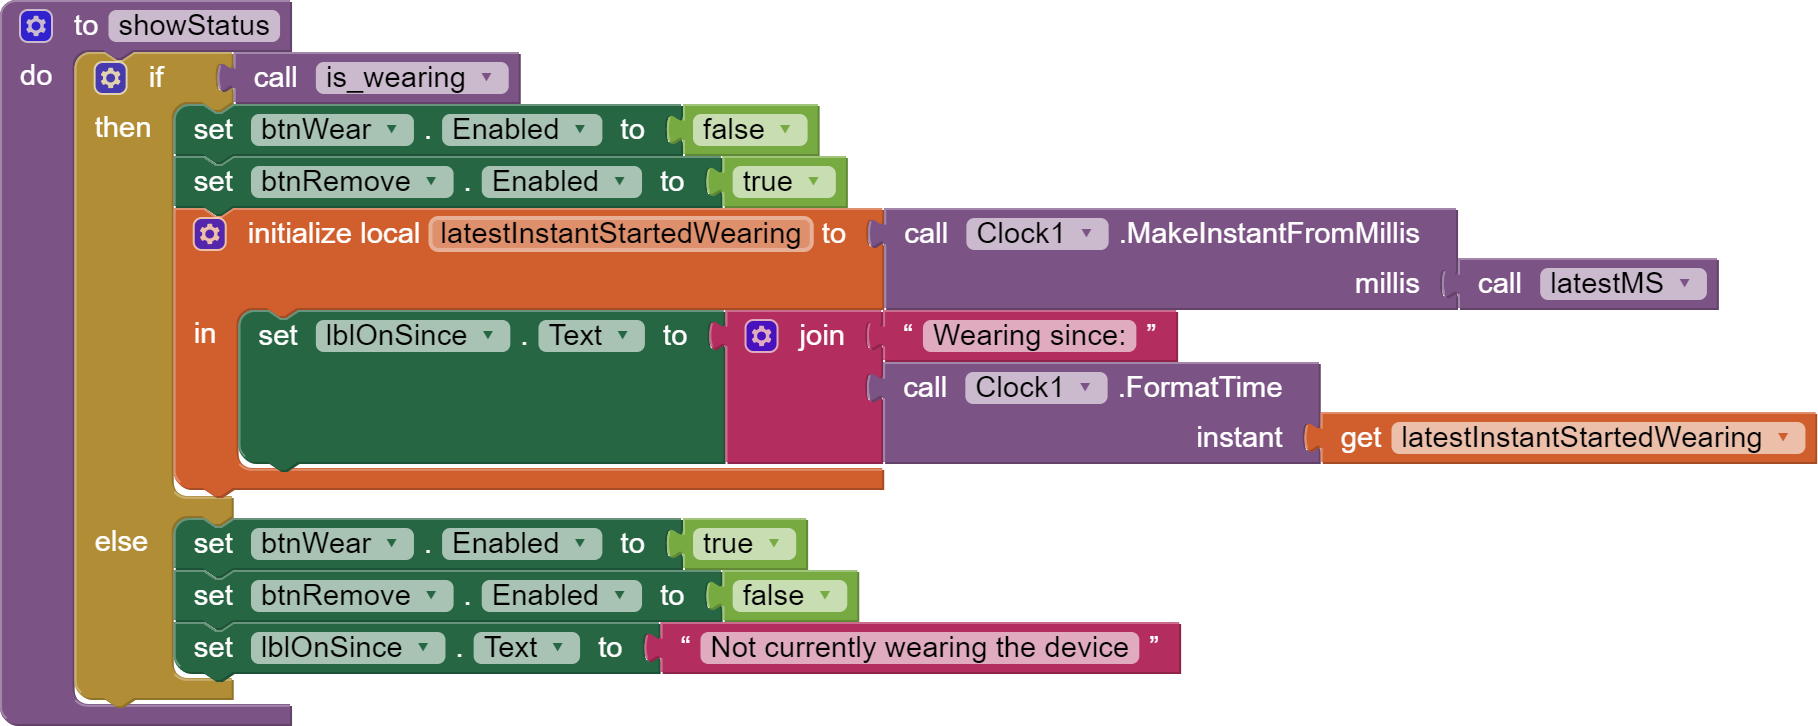
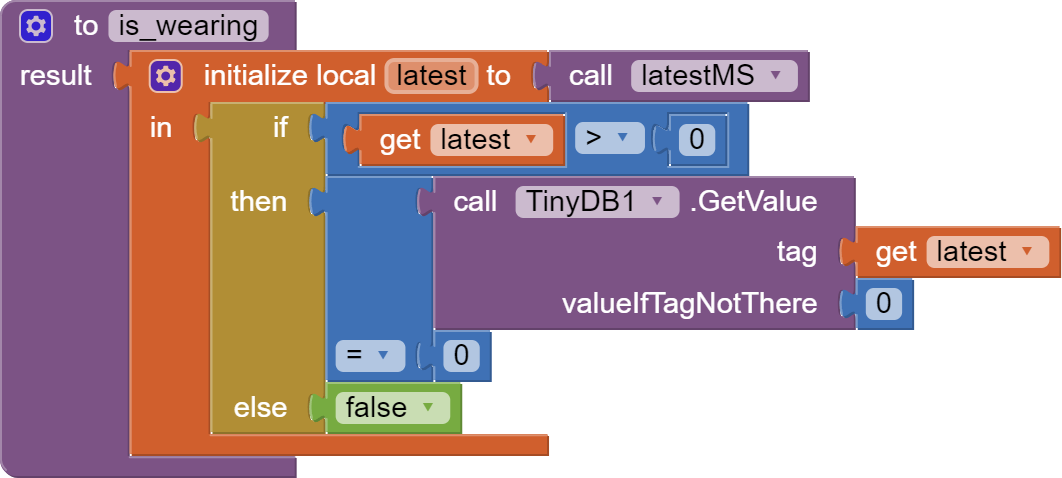
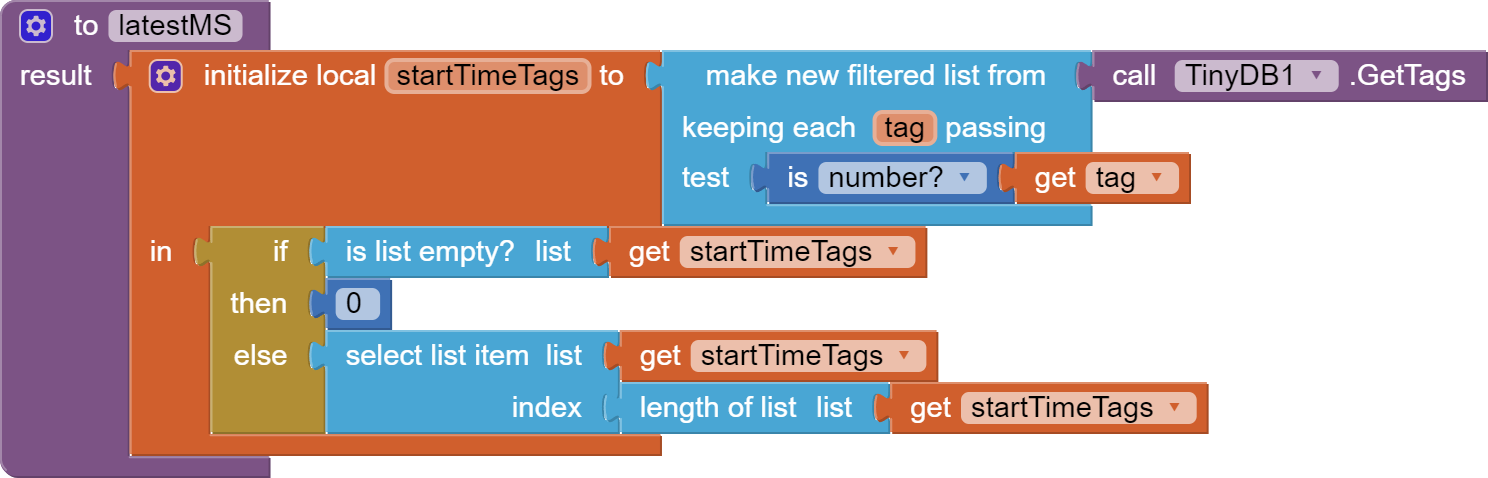
Data Collection:
Graphing:
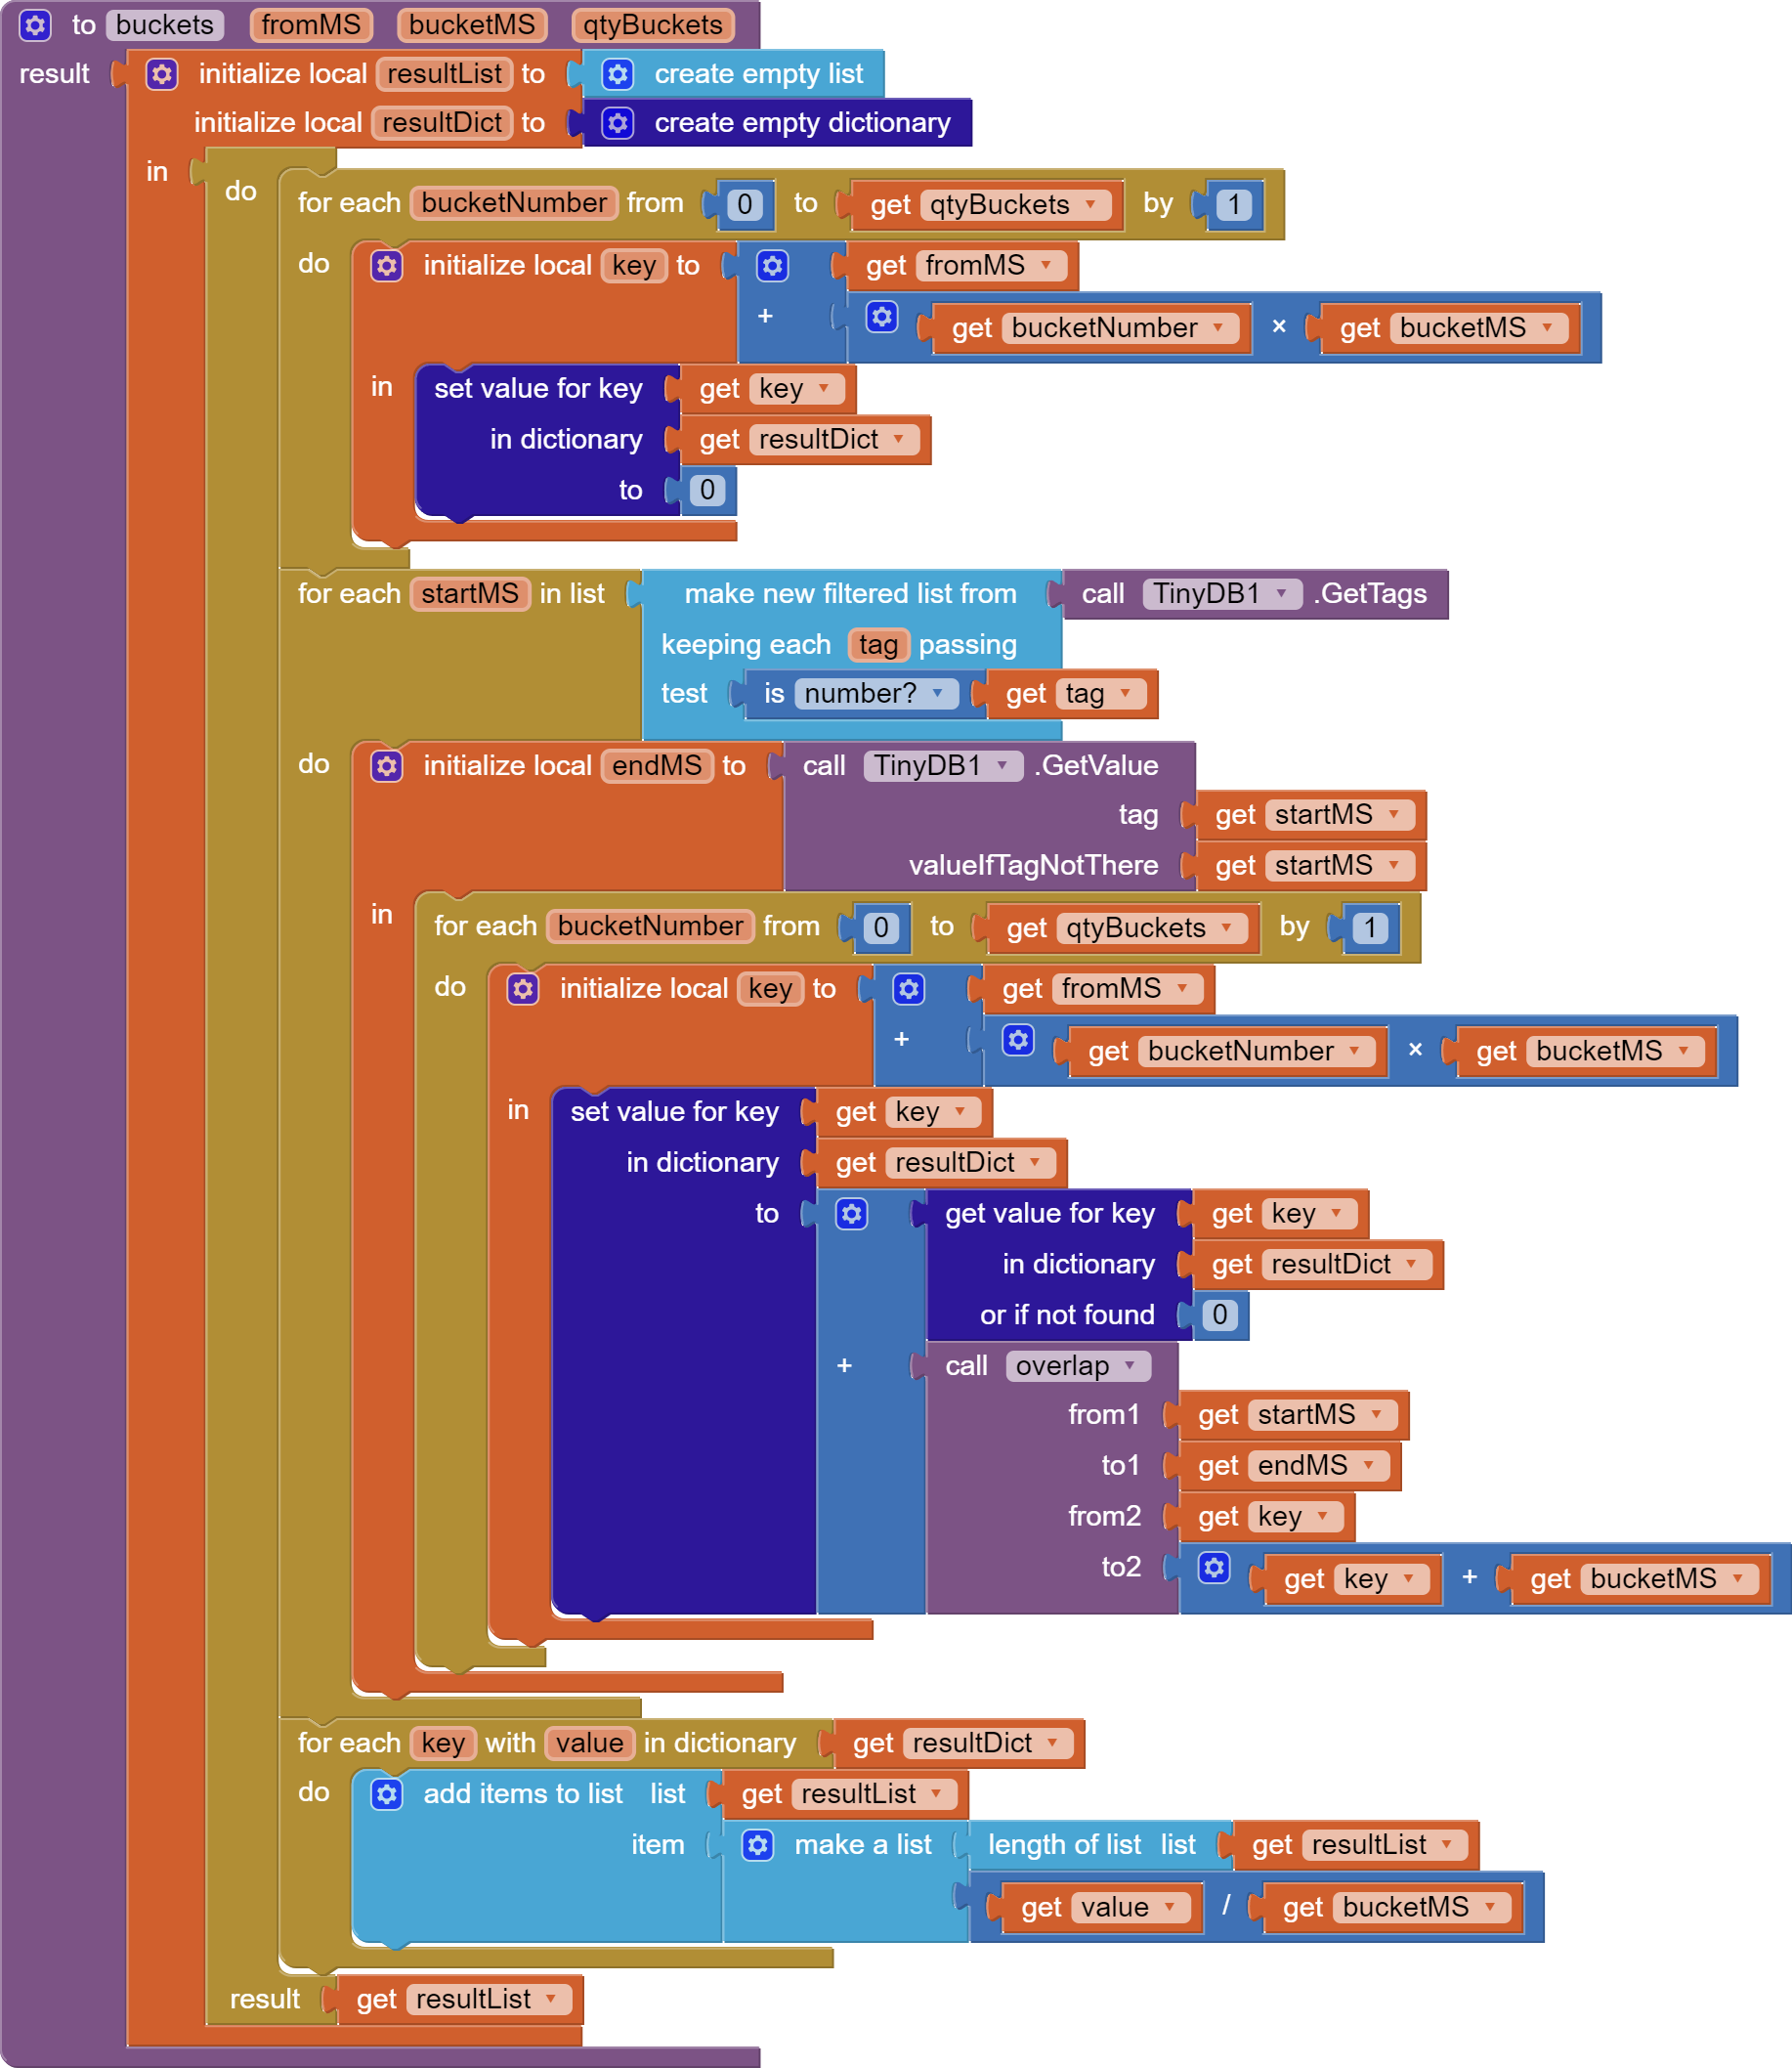
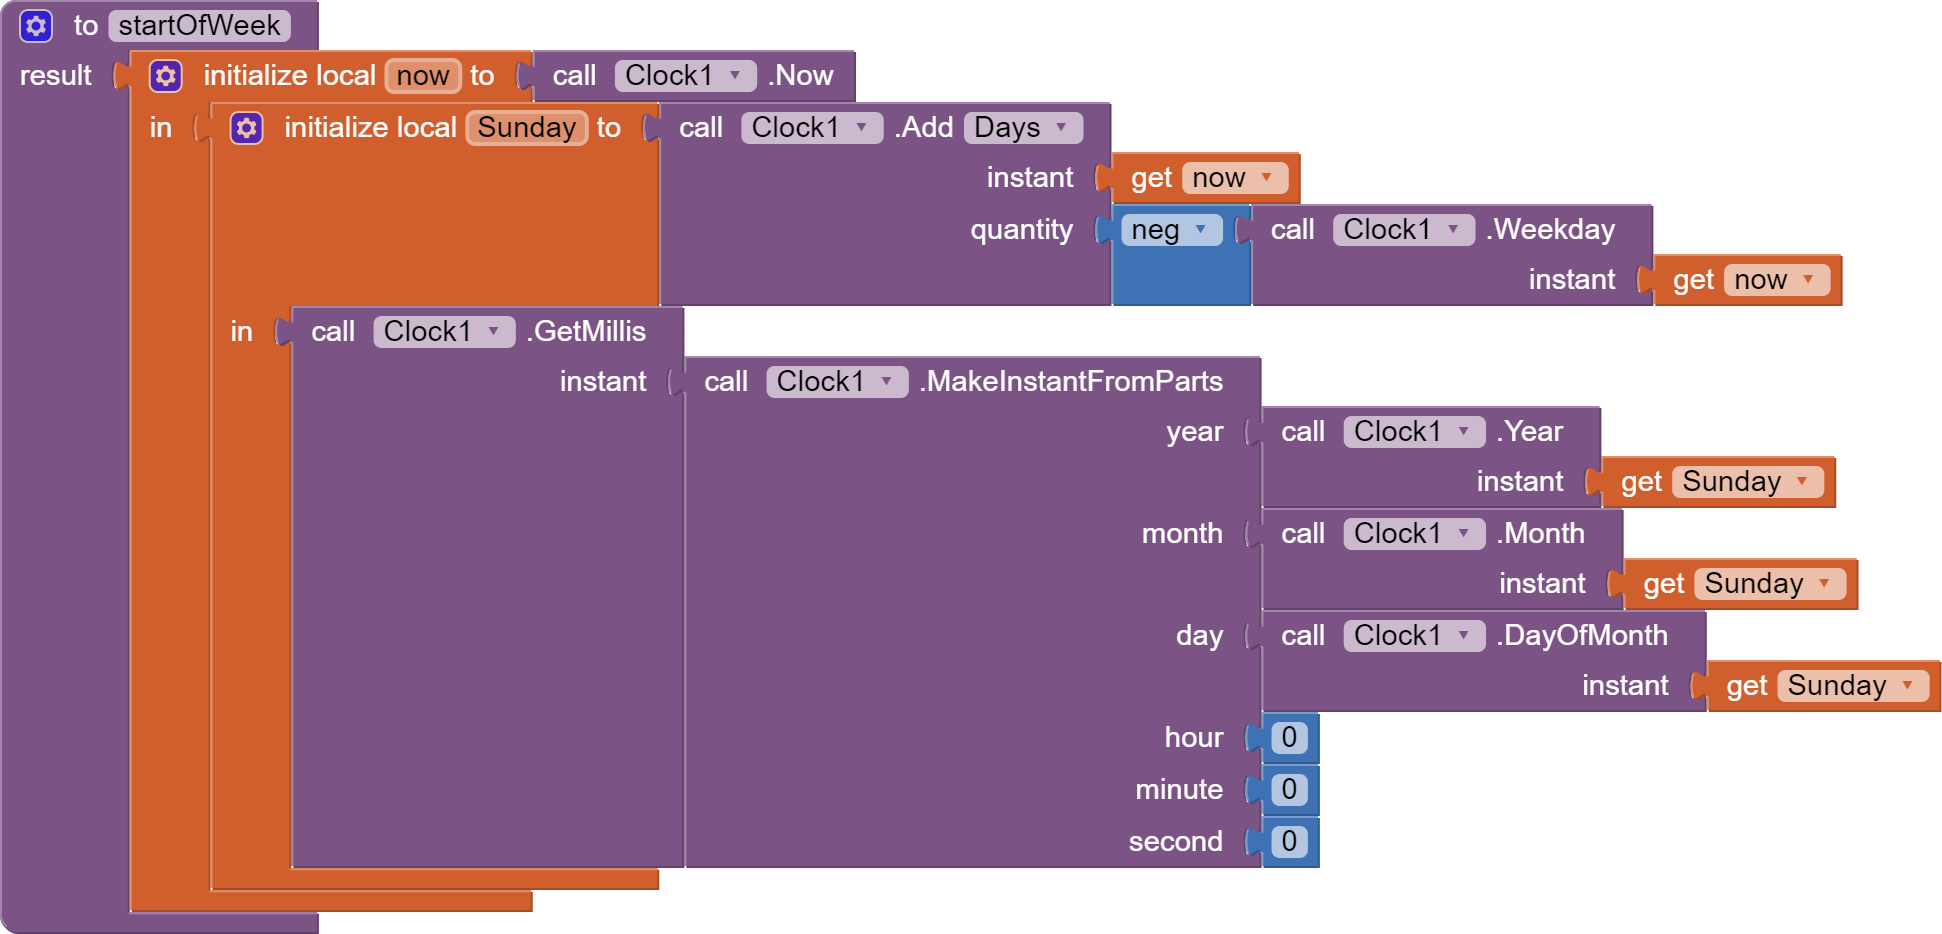
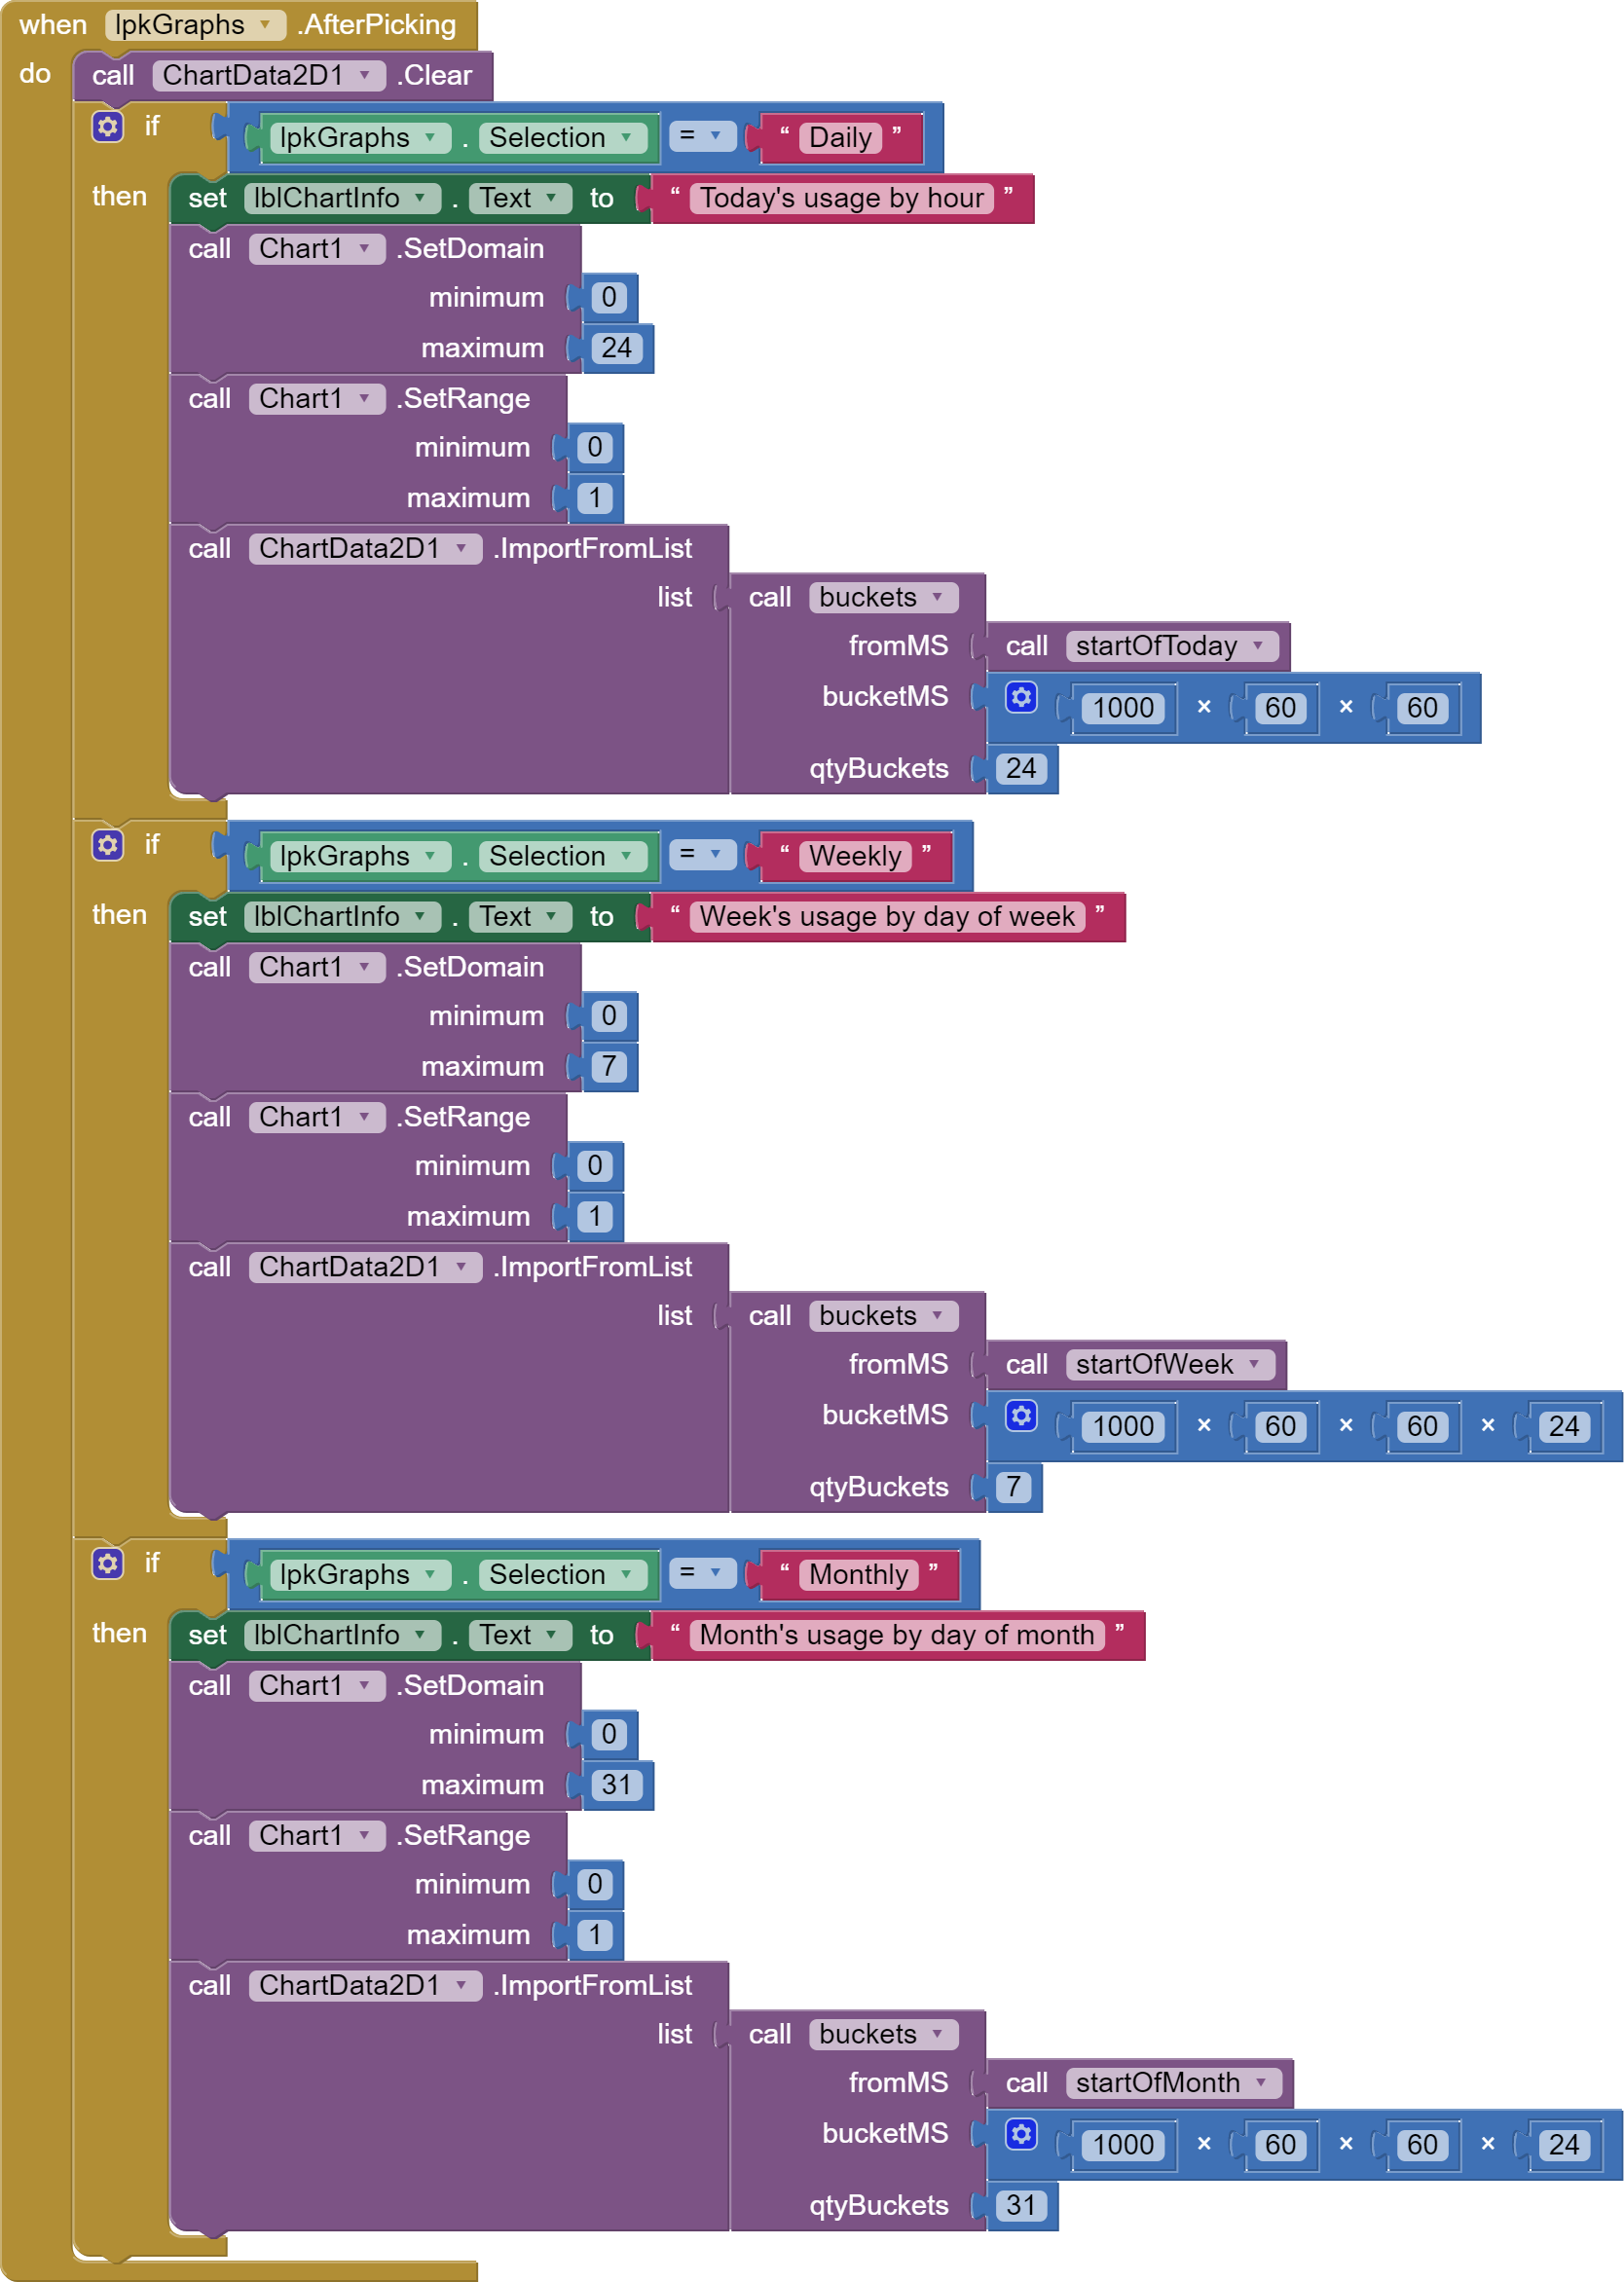
Notice the similarity of the logic across the three scales (a day, a week, a month.)
This logic can be used with any other charting facility, and can be fancied up to taste.