I'm trying to turn a simple on/off indicator into a more detailed/complex display of the information from serial

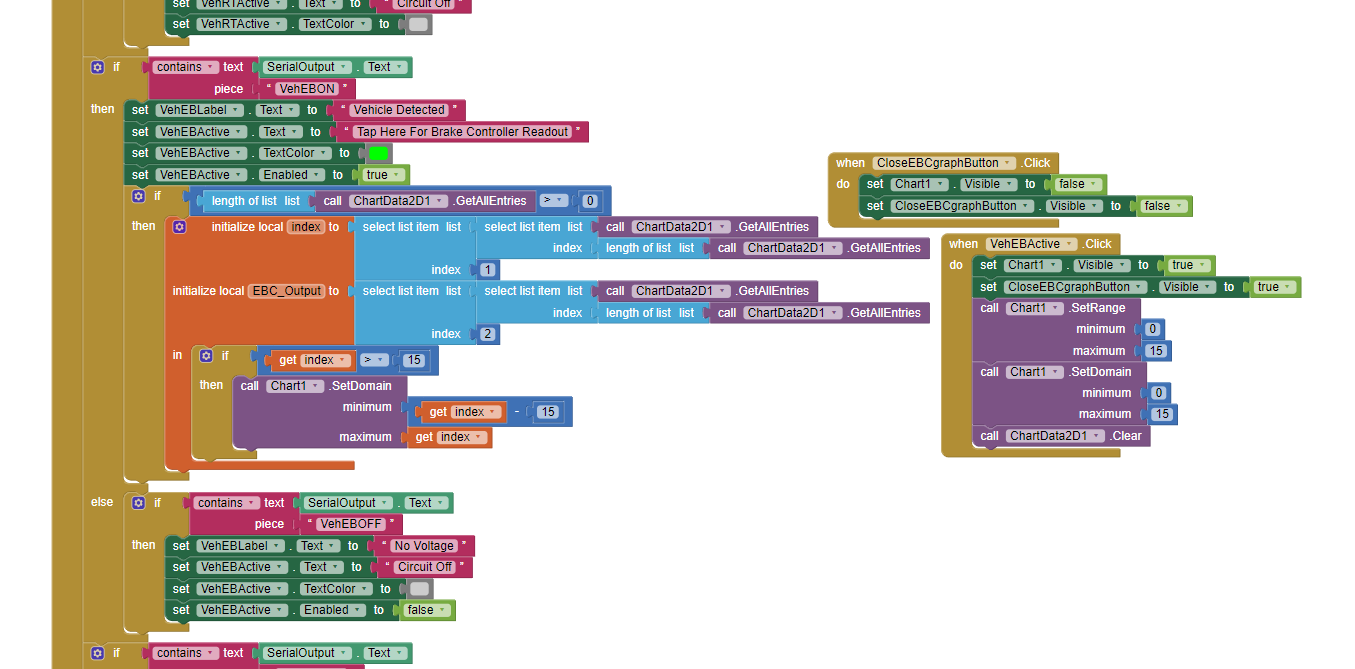
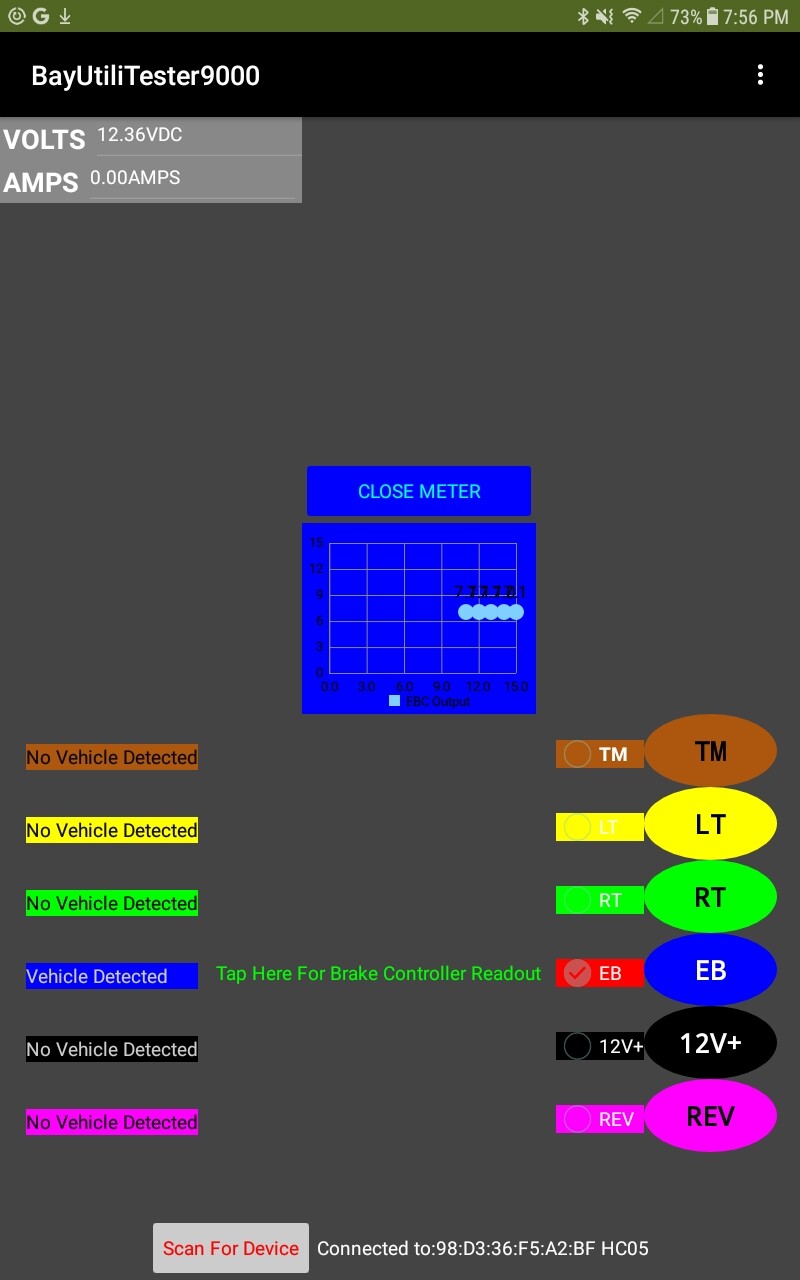
I almost have my app just the way I want it but I have no idea how to go about this last finishing touch. I've attached my aia file to see what I'm talking about, the left side is where my vehicle connector data gets expressed .
With the exception of the blue circuit, all I need to know is whether or not there is voltage on the circuit. As far as I'm concerned, they're either on or off...
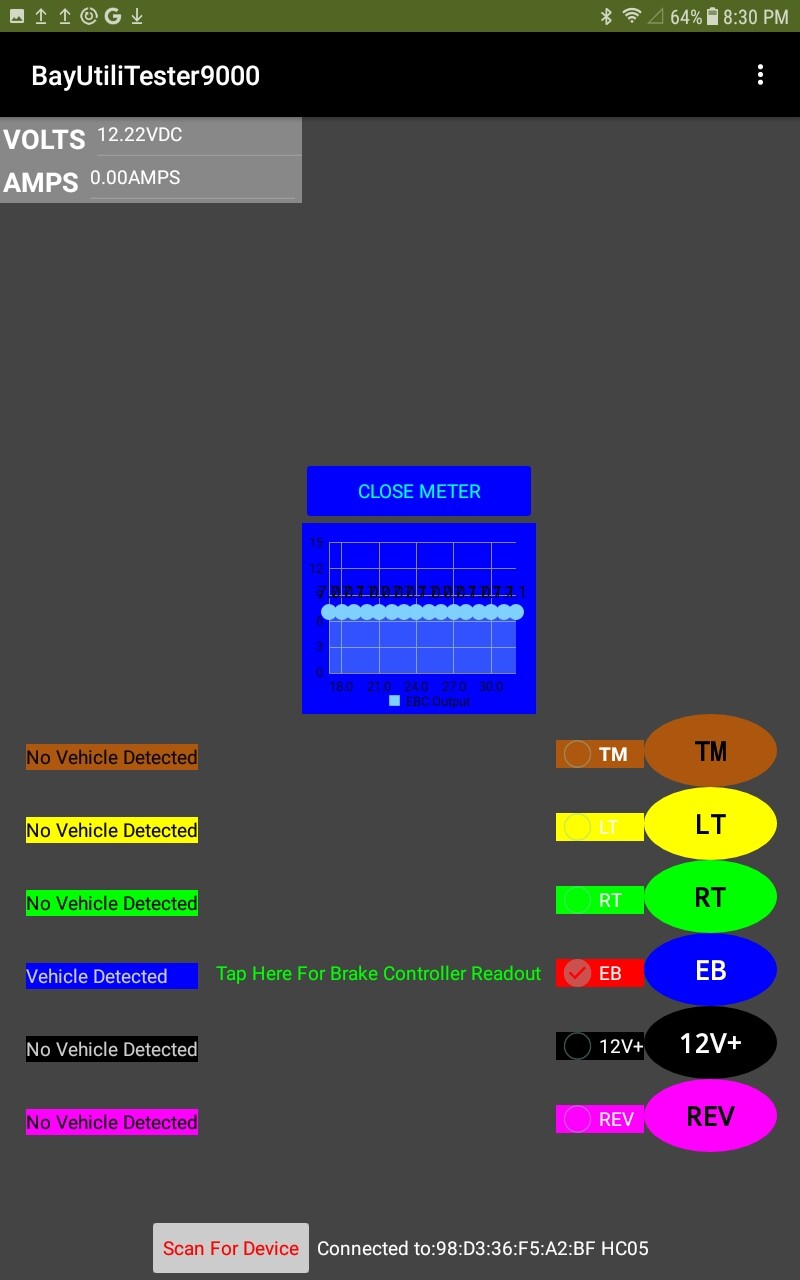
But the blue circuit is receiving it's input from an electric trailer brake controller in the vehicle that gives out a variable voltage depending on how aggressively it's going to operate the trailer's brakes. That's the only circuit that I might need to know how much voltage is on the circuit and see how quickly it changes with the position of the brake pedal so I can roughly tune the output of a newly installed brake controller.

So I'm trying to make it so when that blue circuit goes active from vehicle input, the arduino will switch from sending on/off messages to sending a live voltage number and a scrolling graph pops up in that row that gives a live visual readout, sorta like how the volt and amp meters work but plotted out on a slow oscilloscope looking thing instead of a numerical readout if that makes sense...

I get the ominous feeling I'm opening up a can of worms and asking for something more complicated than I'm prepared to understand even if someone tried to spell it out for me... but I'll give it my all if anyone has the patience to try and help me with this, I would be so very grateful.

many thanks in advance for any assistance that can be offered with this. This community, particularly Patryk, has been so kind and generous with their knowledge and time. My project sat in stagnation for over a year until I discovered MIT AI and you guys have brought new life into it and progressed it in ways I only imagined when I first started building this thing.

BUT9KTOGGLE.aia (99.4 KB)

If you have control over the message traffic arriving via BleTooth, the AI2 Chart and ChartData can accommodate multiple readings graphs in the same chart, in real time.

Here is a post with the particular section of the doc describing that:

In short, you send labelled text readings, one per message, in the form
v:nnnnn
a:nnnnn
where v and a are labels for volts and amps, and each nnnnn is a decimal number.

1 Like

Am I correct in my understanding that using this function of the graph tool will stop the app from receiving other serial data from the arduino while the graph is running? Like, I see that it can receive multiple charting data streams simultaneously, but it sounds like the text commands from the arduino won't be received while the graph is using the data stream?

You're right.

So the GraphData source should not be the BlueTooth component, and should be dynamically loaded from your existing code that catches serial input.

I have an example of such code in another thread I posted today for magnetic field monitoring in a wind speed detector.

If I toggle the graph to be invisible will it keep the data stream going for it? The way it works on the BlueTooth Component can work fine if I can just use on screen buttons to turn the graph off when I don't need it anymore and go back to sending and receiving serial commands. I was hoping maybe just making it invisible would do the trick but I have a feeling it'll be a little more involved than that. I keep accidentally leaving my test tablet at work. I haven't had a chance to try out the graphing stuff at all yet, just been updating the app and arduino coding for when I finally remember to grab it on the way out

Try it.

The Chart component will wait for data with the appropriate tag, I think it will leave the rest of the data intact. But you'd have to test it. When I was doing my test app for the tutorial, the receiveText block was running in parallel with Chart.

I took the examples I saw and plugged them into my project the best I could... The chart pops up and closes when it's supposed to but I can't seem to get any data to populate it... I have data source key set to b: and I checked with a BT serial terminal to make sure the arduino was actually sending the value with the data key b: when it's supposed to. Can't figure out what I'm missing. I've attached my arduino code and a screen shot of the blocks for my chart. The left side is my clock timer block. For some reason it just won't export the .aia right now or I would attach that instead of a screenshot

#include <SoftwareSerial.h>
SoftwareSerial mySerial(10, 11); // RX, TX

const int vehTMPin = A0; 
const int vehLTPin = A1;
const int vehRTPin = A2;
const int vehEBPin = A3;
const int vehAUXPin = A4;
const int vehREVPin = A5;
const int voltMeterPin = A6;
const int ampMeterPin = A7;  

unsigned long previousMillis = 0; // one quarter second update interval on Meters to slow down readings on serial channel
const long interval1 = 250;

int vehTMVal, vehLTVal, vehRTVal, vehAUXVal, vehREVVal;
int vehTMstate = 0, vehLTstate = 0, vehRTstate = 0, vehEBstate = 0, vehAUXstate = 0, vehREVstate = 0;
float voltMeter, vltMtrReadout, ampMeter, ampMtrReadout, vehEBVal, brake;


const int relay1Pin = 2;
const int relay2Pin = 3;
const int relay3Pin = 4;
const int relay4Pin = 5;
const int relay5Pin = 6;
const int relay6Pin = 7;


int relay1State = LOW;
bool relay2State = false;
bool relay3State = false;
int relay4State = LOW;
int relay5State = LOW;
int relay6State = LOW;

unsigned long previousTime1 = 0;
unsigned long previousTime2 = 0;
unsigned long interval = 350;

bool flashState1 = false;
bool flashState2 = false;

void setup() {

  pinMode(relay1Pin, OUTPUT);
  pinMode(relay2Pin, OUTPUT);
  pinMode(relay3Pin, OUTPUT);
  pinMode(relay4Pin, OUTPUT);
  pinMode(relay5Pin, OUTPUT);
  pinMode(relay6Pin, OUTPUT);

  digitalWrite(relay2Pin, LOW);
  digitalWrite(relay3Pin, LOW);

  Serial.begin(9600);
  mySerial.begin(9600);
}

void loop() {
 //Inputs from the vehicle connector
  vehTMVal = analogRead(vehTMPin); 
  vehLTVal = analogRead(vehLTPin);
  vehRTVal = analogRead(vehRTPin);
  vehEBVal = analogRead(vehEBPin);
  vehAUXVal = analogRead(vehAUXPin);
  vehREVVal = analogRead(vehREVPin);
  voltMeter = analogRead(voltMeterPin);
  ampMeter = analogRead(ampMeterPin);
  vltMtrReadout = (20.49/1023.)*voltMeter;   //volt sensor calibration
  ampMtrReadout = ((ampMeter-606.)/19.3)-2.1;//<--breadboard, deployed build-->(ampMeter-513.)/9.8; 
  brake = (26./1023.)*vehEBVal;  //starting point of calibration, need charting component working to dial this in

  unsigned long currentMillis = millis();//interval set to 250ms, adjust at top of sketch
  if (currentMillis - previousMillis >= interval1) {
    previousMillis = currentMillis;
    mySerial.print(vltMtrReadout);
    mySerial.println("VDC");
   if (vehEBstate == 1){
    mySerial.print(brake);   //Data for Electric Brake output chart component in app
    mySerial.println("b:");  //
    }
   if (ampMtrReadout <= 0.29){
     mySerial.print("0.00");
     mySerial.println("AMPS");
   }
   else if (ampMtrReadout >= 0.3){
    mySerial.print(ampMtrReadout);
    mySerial.println("AMPS");
   }
  }
  
  if (mySerial.available()) { 
    char command = mySerial.read();
    switch (command) {
      case '1':
        digitalWrite(relay1Pin, !digitalRead(relay1Pin));
        relay1State = digitalRead(relay1Pin);
        mySerial.print("1!");
        mySerial.println(relay1State);
        break;
 
      case '2':
        relay2State = !relay2State;
      digitalWrite(relay2Pin, relay2State);       
        relay2State = digitalRead(relay2Pin);
        if (relay2State) {
        previousTime1 = millis();
        flashState1 = true;
      }
      else {
        flashState1 = false;
      }
        mySerial.print("2!");
        mySerial.println(relay2State);
        break;
 
      case '3':
        relay3State = !relay3State;
      digitalWrite(relay3Pin, relay3State);
        relay3State = digitalRead(relay3Pin);
        if (relay3State) {
        previousTime2 = millis();
        flashState2 = true;
      }
      else {
        flashState2 = false;
      }
        mySerial.print("3!");
        mySerial.println(relay3State);
        break;
     
      case '4':
        digitalWrite(relay4Pin, !digitalRead(relay4Pin));
        relay4State = digitalRead(relay4Pin);
        mySerial.print("4!");
        mySerial.println(relay4State);
        break;

      case '5':
        digitalWrite(relay5Pin, !digitalRead(relay5Pin));
        relay5State = digitalRead(relay5Pin);
        mySerial.print("5!");
        mySerial.println(relay5State);
        break;

      case '6':
        digitalWrite(relay6Pin, !digitalRead(relay6Pin));
        relay6State = digitalRead(relay6Pin);
        mySerial.print("6!");
        mySerial.println(relay6State);
        break;
      default:
        break;
    }
  }

//vehicle side
if (vehTMVal >= 75 && vehTMstate == 0) { 
    mySerial.println("VehTMON"); 
    vehTMstate = 1; 
  } else if (vehTMVal < 75 && vehTMstate == 1) {
    mySerial.println("VehTMOFF");
    vehTMstate = 0;
  }

  if (vehLTVal >= 75 && vehLTstate == 0) {
    mySerial.println("VehLTON");
    vehLTstate = 1;
  } else if (vehLTVal < 75 && vehLTstate == 1) {
    mySerial.println("VehLTOFF");
    vehLTstate = 0;
  }

  if (vehRTVal >= 75 && vehRTstate == 0) {
    mySerial.println("VehRTON");
    vehRTstate = 1;
  } else if (vehRTVal < 75 && vehRTstate == 1) {
    mySerial.println("VehRTOFF");
    vehRTstate = 0;
  }

  if (vehEBVal >= 75 && vehEBstate == 0) {
    mySerial.println("VehEBON");
    vehEBstate = 1;
  
  } else if (vehEBVal < 75 && vehEBstate == 1) {
    mySerial.println("VehEBOFF");
    vehEBstate = 0;
  }

  if (vehAUXVal >= 75 && vehAUXstate == 0) {
    mySerial.println("VehAUXON");
    vehAUXstate = 1;
  } else if (vehAUXVal < 75 && vehAUXstate == 1) {
    mySerial.println("VehAUXOFF");
    vehAUXstate = 0;
  }

  if (vehREVVal >= 75 && vehREVstate == 0) {
    mySerial.println("VehREVON");
    vehREVstate = 1;
  } else if (vehREVVal < 75 && vehREVstate == 1) {
    mySerial.println("VehREVOFF");
    vehREVstate = 0;
  }
//Turn Signal flasher
if (flashState1) {
    unsigned long currentTime = millis();
    if (currentTime - previousTime1 >= interval) {
      previousTime1 = currentTime;
      digitalWrite(relay2Pin, !digitalRead(relay2Pin));
    }
  }
  if (flashState2) {
    unsigned long currentTime = millis();
    if (currentTime - previousTime2 >= interval) {
      previousTime2 = currentTime;
      digitalWrite(relay3Pin, !digitalRead(relay3Pin));
    }
  }

}

Which data should be received by Chart? What is the Tag set in Chart. Are you getting cyclic b:... data in the terminal?

You are sending the b: after the number.

You should send the b: first, then println the number.

Also, the chartdata component should be set to b (not b:) - Sorry, got that wrong - ABG

Search this board for charts usage guide.

From Bluetooth Client Polling Rate - #12 by ABG :

Bluetooth

In order to import real time data via Bluetooth, the BluetoothClient component should be used either via the Source property, or the ChangeDataSource block.

First, it is important to set the corresponding DelimiterByte in the BluetoothClient component (see Figure 62). This byte is used to separate each individual incoming value (which also has to be taken care of on the Bluetooth client side)

Figure 62: BluetoothClient DelimiterByte property example

The key value (or the DataSourceValue) for the case of Bluetooth data importing corresponds to the prefix of the data. For example, if the data were to be retrieved in the format t:5, the prefix t: could be specified to properly retrieve the value 5 as the data (Figure 63 shows an example of the setup). However, if the data is retrieved as numeric values (simply 5, for example), then the DataSourceValue should be left empty.

It is important to note that the BluetoothClient acts as a real time Data Source. As soon as data is available, the data is read, and sent to the Data Series. This means that Read blocks will no longer function on the BluetoothClient, since it is being read by the Data Series. However, as many Data Series as needed may make use of a single BluetoothClient (even with multiple prefixes). Incoming values with prefixes that do not match the Data component’s DataSourceValue are ignored by that Data Series (but are sent to all Data Series using the BluetoothClient as a Source).

Figure 63: BluetoothClient Source property settings example

1 Like

The data I'm trying to display in the chart is the output of an electric trailer brake controller in a vehicle. It's maximum output is something like 13.5v to14v if the vehicle is running. That goes through a voltage divider to pin A3 (vehEBPin), gets analogRead to vehEBVal, get's converted to brake, which is what's written to serial with the "b:". I was using a separate Bluetooth Serial Terminal app to send the commands manually and make sure it was sending the b: data when pin A3 is in the appropriate state.

I actually got the data to start plotting on the chart one time! but then it just stopped and hasn't done it again since... I'm trying to figure out what to do with this delimiter byte thing, it looks like that might help because I see crazy numbers popping up in the volt meter and amp meter sometimes when the brake b: data is being sent. I set the delimiter byte to 10 and put that in the arduino sketch after each value is written to serial. So far, nothing but I'll keep tinkering at it.

I changed the datasourcekey to "brake:" and now it seems to be at least registering in the chart that there is data to read because I see "EBC output" show up at the bottom of the chart, but it's pretty consistently crashing after that point. I keep having to restart the companion and reconnect. It's letting me export the .aia file now so I attached it here.

Changing the datasourcekey seems to make it recognize there's something to read, immediately crash and then it goes back to not seeing anything and I have to change the data source key a few more times before it will start seeing it for a split second. I'm still not fully understanding what to do with the delimiter byte either. prolly gonna have to go clear my mind and come back to this later =/
BUT9KTOGGLE (1).aia (101.8 KB)

In my tutorial there is aia file and code for esp32, all in all the code generates random numbers so it's easy to do it in arduino. You can download these examples and see how it works.

1 Like

I changed up the arduino code so it either sends the values for the volt and amp meters, or it sends the values for the Brake Controller, but not both at the same time anymore. I don't know why I'd ever need to use the on board power supply and the vehicle connector at the same time so it won't affect the tool's functionality for the user to not know the power supply readings while testing a vehicle. I also took the ":" out of the datasourcekey. The app is now consistently plotting data in the chart without crashing every time! it still seems to crash every now and then tho, but at least it's progress!

The chart isn't scrolling like yours does though. Once the points reach the right side of the chart, it just stops. Any idea how I can get the plotted points to shift left as new points are plotted?

UPDATE!: I just had to move the instructions for scrolling the chart over to the main tab of the clock block instead of the vehEB command condional I had it under! and now it's scrolling and plotting the data in real time! this is amazing!


Thank you guys so much for all the help!