Could anyone point out some suggestions on how to import data from the chatbot to the bar graph automatically?
From the results from this page
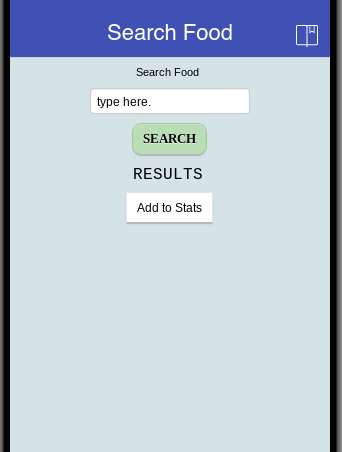
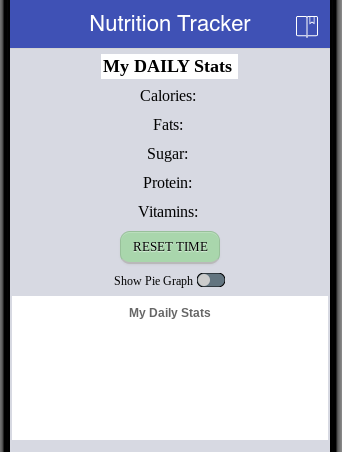
to this page
Any suggestions will be greatly appreciated!
Could anyone point out some suggestions on how to import data from the chatbot to the bar graph automatically?
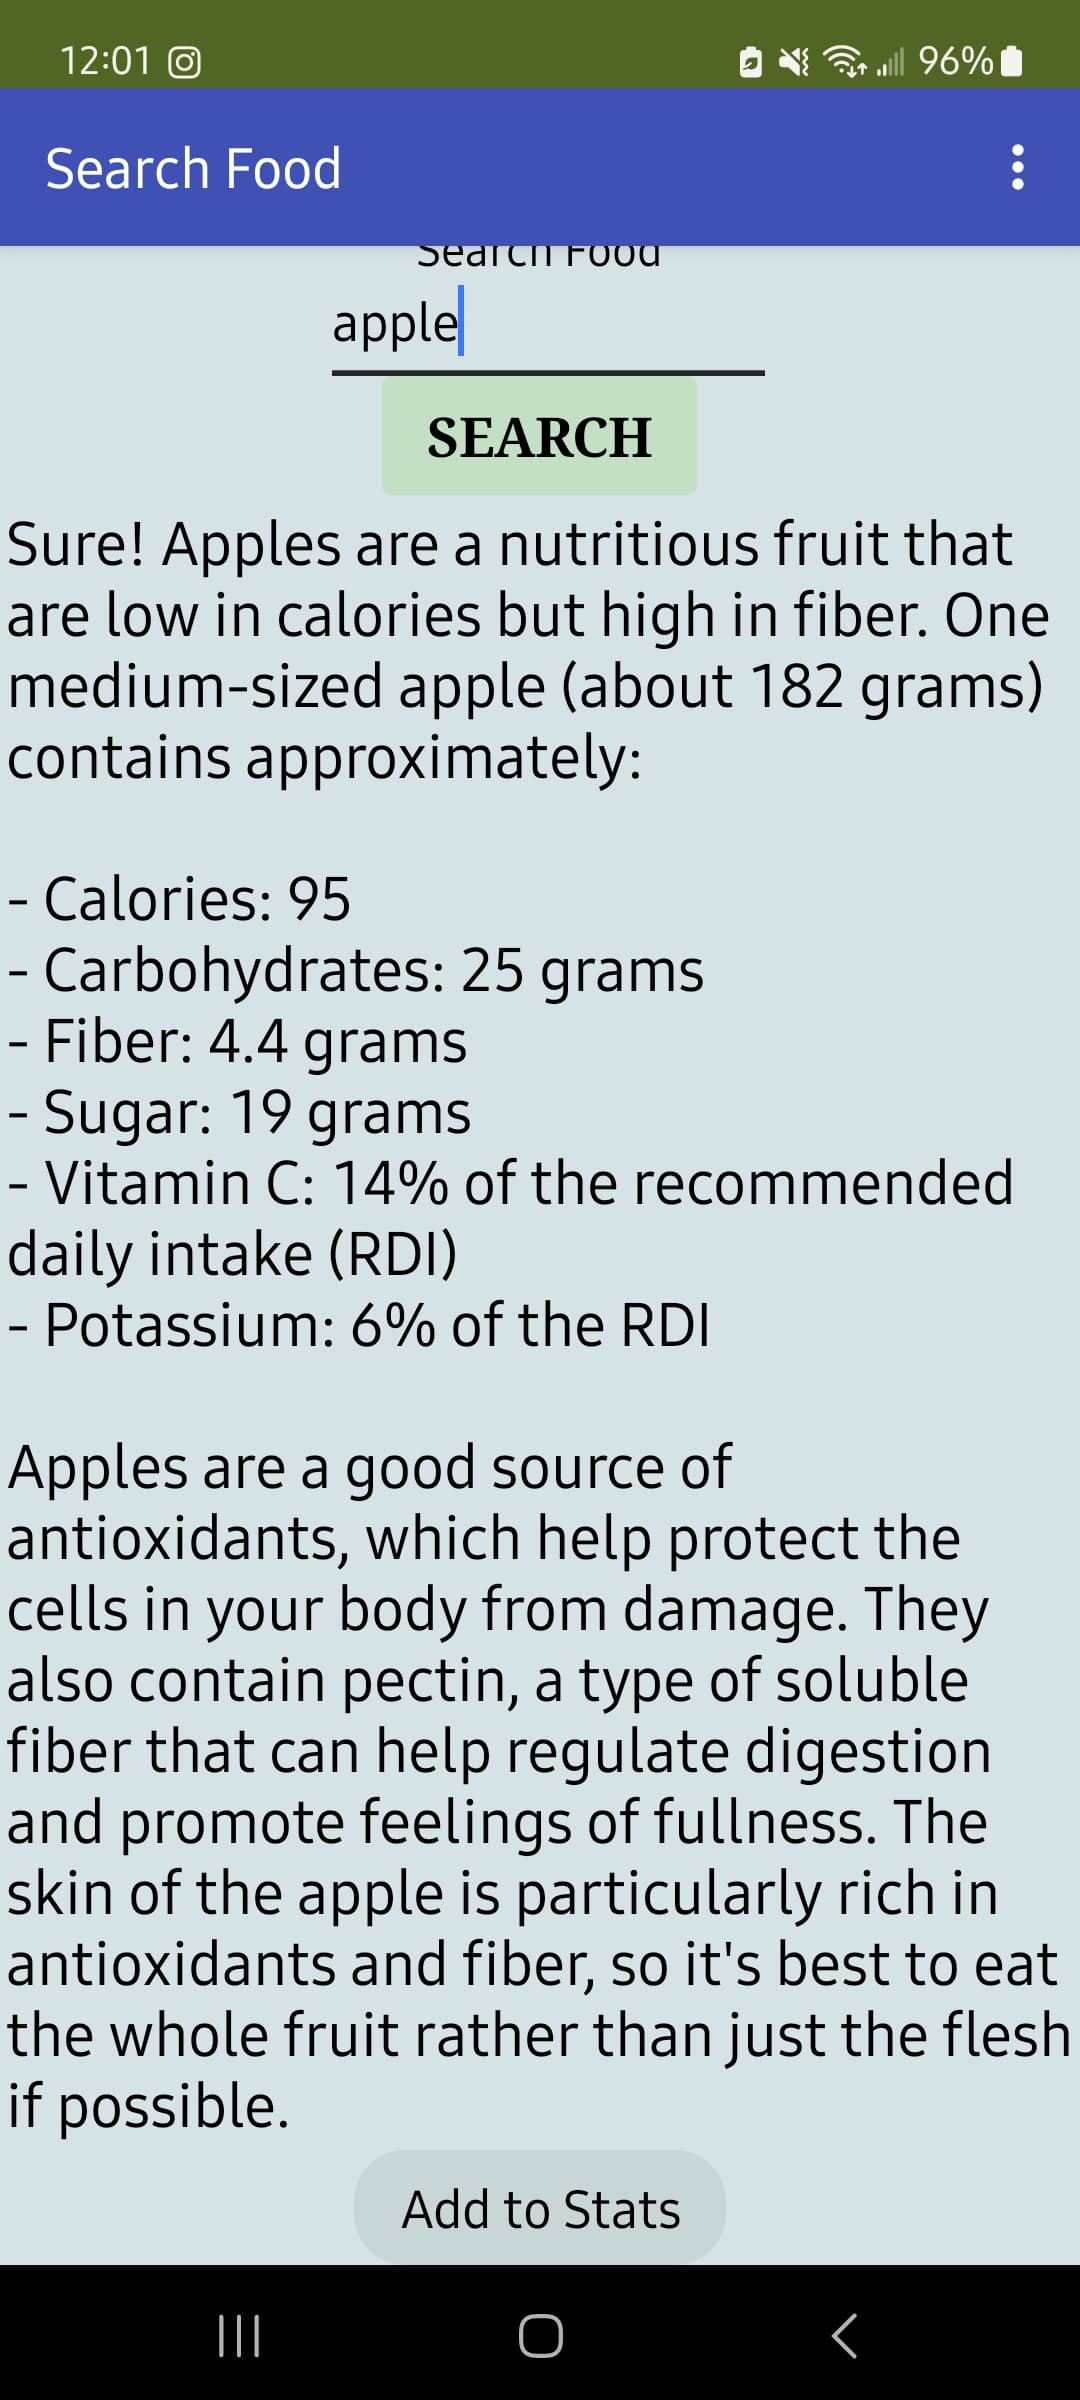
From the results from this page
what kind of data you get from the chatbot? show us in plain text here.
This text follows a format that can be parsed to extract a dictionary of unit nutritional information.
The attributes are between the '-' and the ':' on each line (ending in \n)
The object key ('one medium sized apple') is at the front of the sentence ending in 'contains approximately:'
But then, how many other food types will come back in this format?
I don't know.
Thanks for the suggestion! I'm thinking of starting with a test run to see how it works. Once I've got that figured out, I'll then check how many different types of food I'll need. Any suggestions on how I can extract a dictionary of unit nutritional information and make this work?
It's impossible to predict any pattern with only one sample.
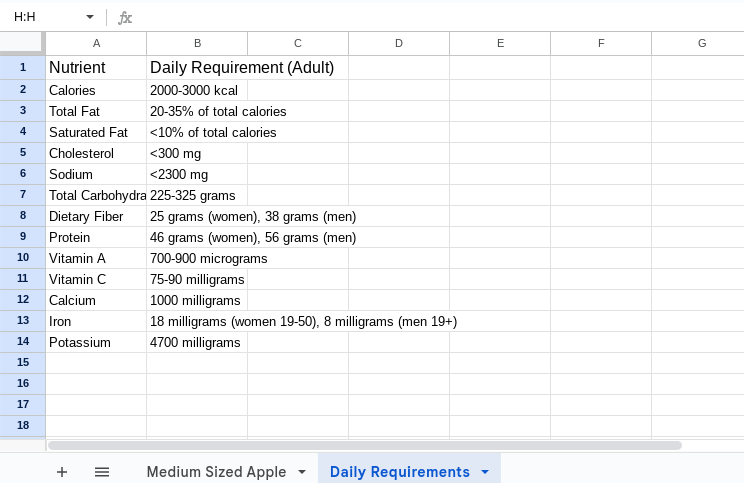
You have a minimum of five different scales in your disparate dataset. How do you want to display these on a single bar chart? They will be fairly meaningless without a reference, perhaps daily recommended intake alongside each one ?
Yeah, I'm looking forward to displaying the chart as a daily recommended intake alongside each one.
Could you please guide me on how to do it?
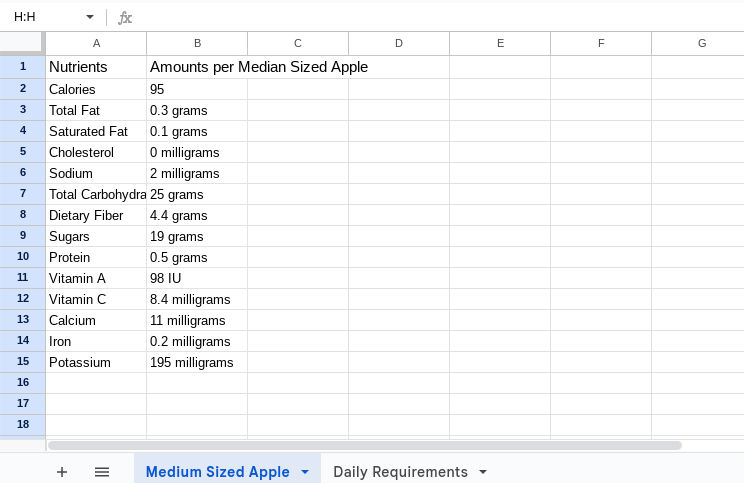
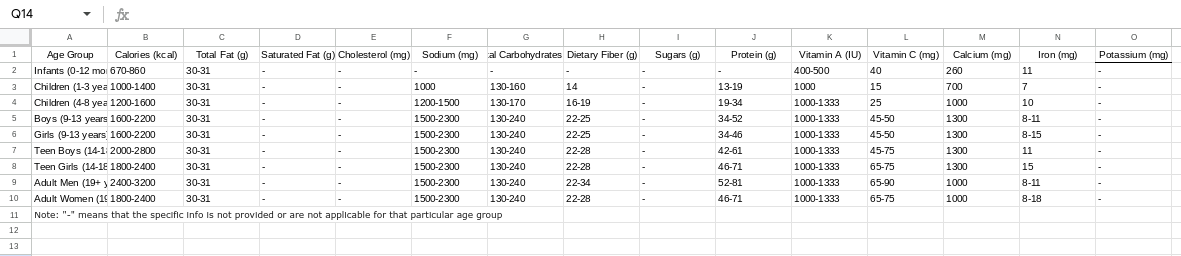
You have the intake from one apple, a row in a table with five or six columns for the calories, vitamins, etc.
You need a row in a similar table with a day's minimum.
You need an. Input dialogue to accept how many apples were eaten that day, along with all the other foods that were eaten, to fill out the sheet of food nutrient quantities
I'm supposed to do that in Google Sheets right?
You need at least 2, maybe three sheets:
Each table would be a separate sheet, with its own headings and primary key.
That design would have too many sheets, for so many types of food.
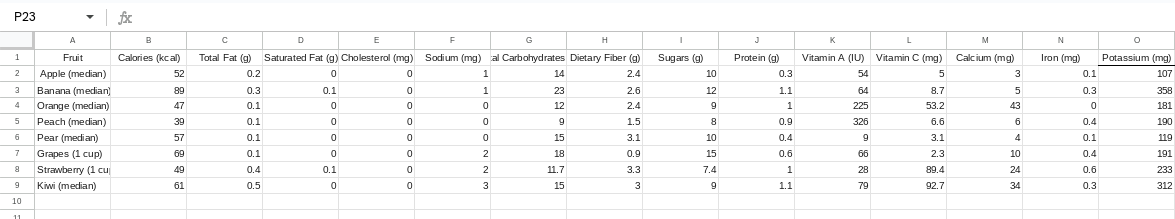
Instead, turn those 15 rows into columns, and fill in one row per food, all in the same sheet.
Each additional food type should be an extra row.
Now you are ready for the third sheet, the detailed food log by date (and person if tracking multiple people).
The food log looks like the first sheet, except it has three extra columns at the left:
The calories, fat, etc columns in each row could be multiplied by the quantity to get the contribution of that food to his daily consumption.
Do I just make the names and their data randomly or am I just supposed to set up the sheet?
This sheet needs its headings.
Past that, you would have to write the app to feed it new rows as the user(s) eat.
No one would complain if you add a few test users and their fake consumption.
Like this?

That looks good.
Now you have two alternative ways to sum and group by user and date:
It would not hurt to study both.