Get the data:
https://docs.google.com/spreadsheets/d/<file ID>/export?format=csv
Get the data:
https://docs.google.com/spreadsheets/d/<file ID>/export?format=csv
I got my data all set up already.
What is the issue then ?
I want to use the data I set up already in Google Sheets to add it to the chart component in my app.
Yes, you say you have the data.
Which chart method are you intending to use ? This will dictate how you data must be organised in order to build a chart.
Please provide an example of the data, and information on your chart method.
See the Web section of
Thanks, I'll take a look at that.
and with what part of the data do you want to make a pie chart?
The amount of nutrition.
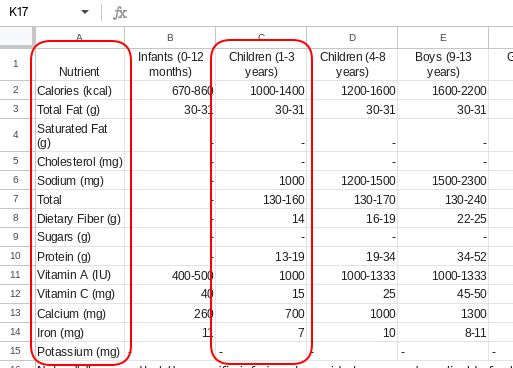
For example, this dataset (in the red rectangles)?

You will need to remove the values that are ranges, and replace them with a single figure, set any empty values, or values with a - to 0.
The pie chart will be all over the place because you have different scales for different nutrients, e.g. calories (kcal) 1200 and Iron (mg) 7.
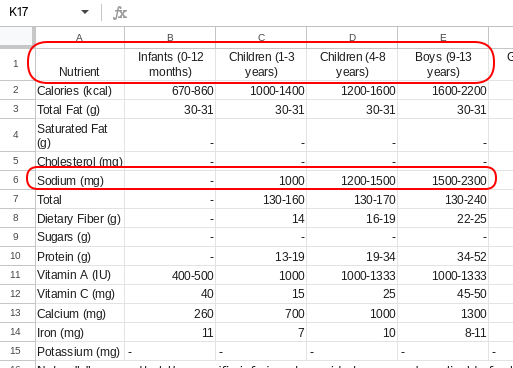
Or do you want to show a single nutrient like so:

Again, you would need to replace any ranges with single values...
Where do I find the component ChartMakerPlus1?
It is an extension. You will require online access.
Okay, I got it, thank you so much!
I can't find the extension ChartMakerPlus1, I can only find ChatMaker1
I found it, thanks.
Where's the global array table?