πŸ“Š [Free] ChartMakerPlus - an extension to make google charts

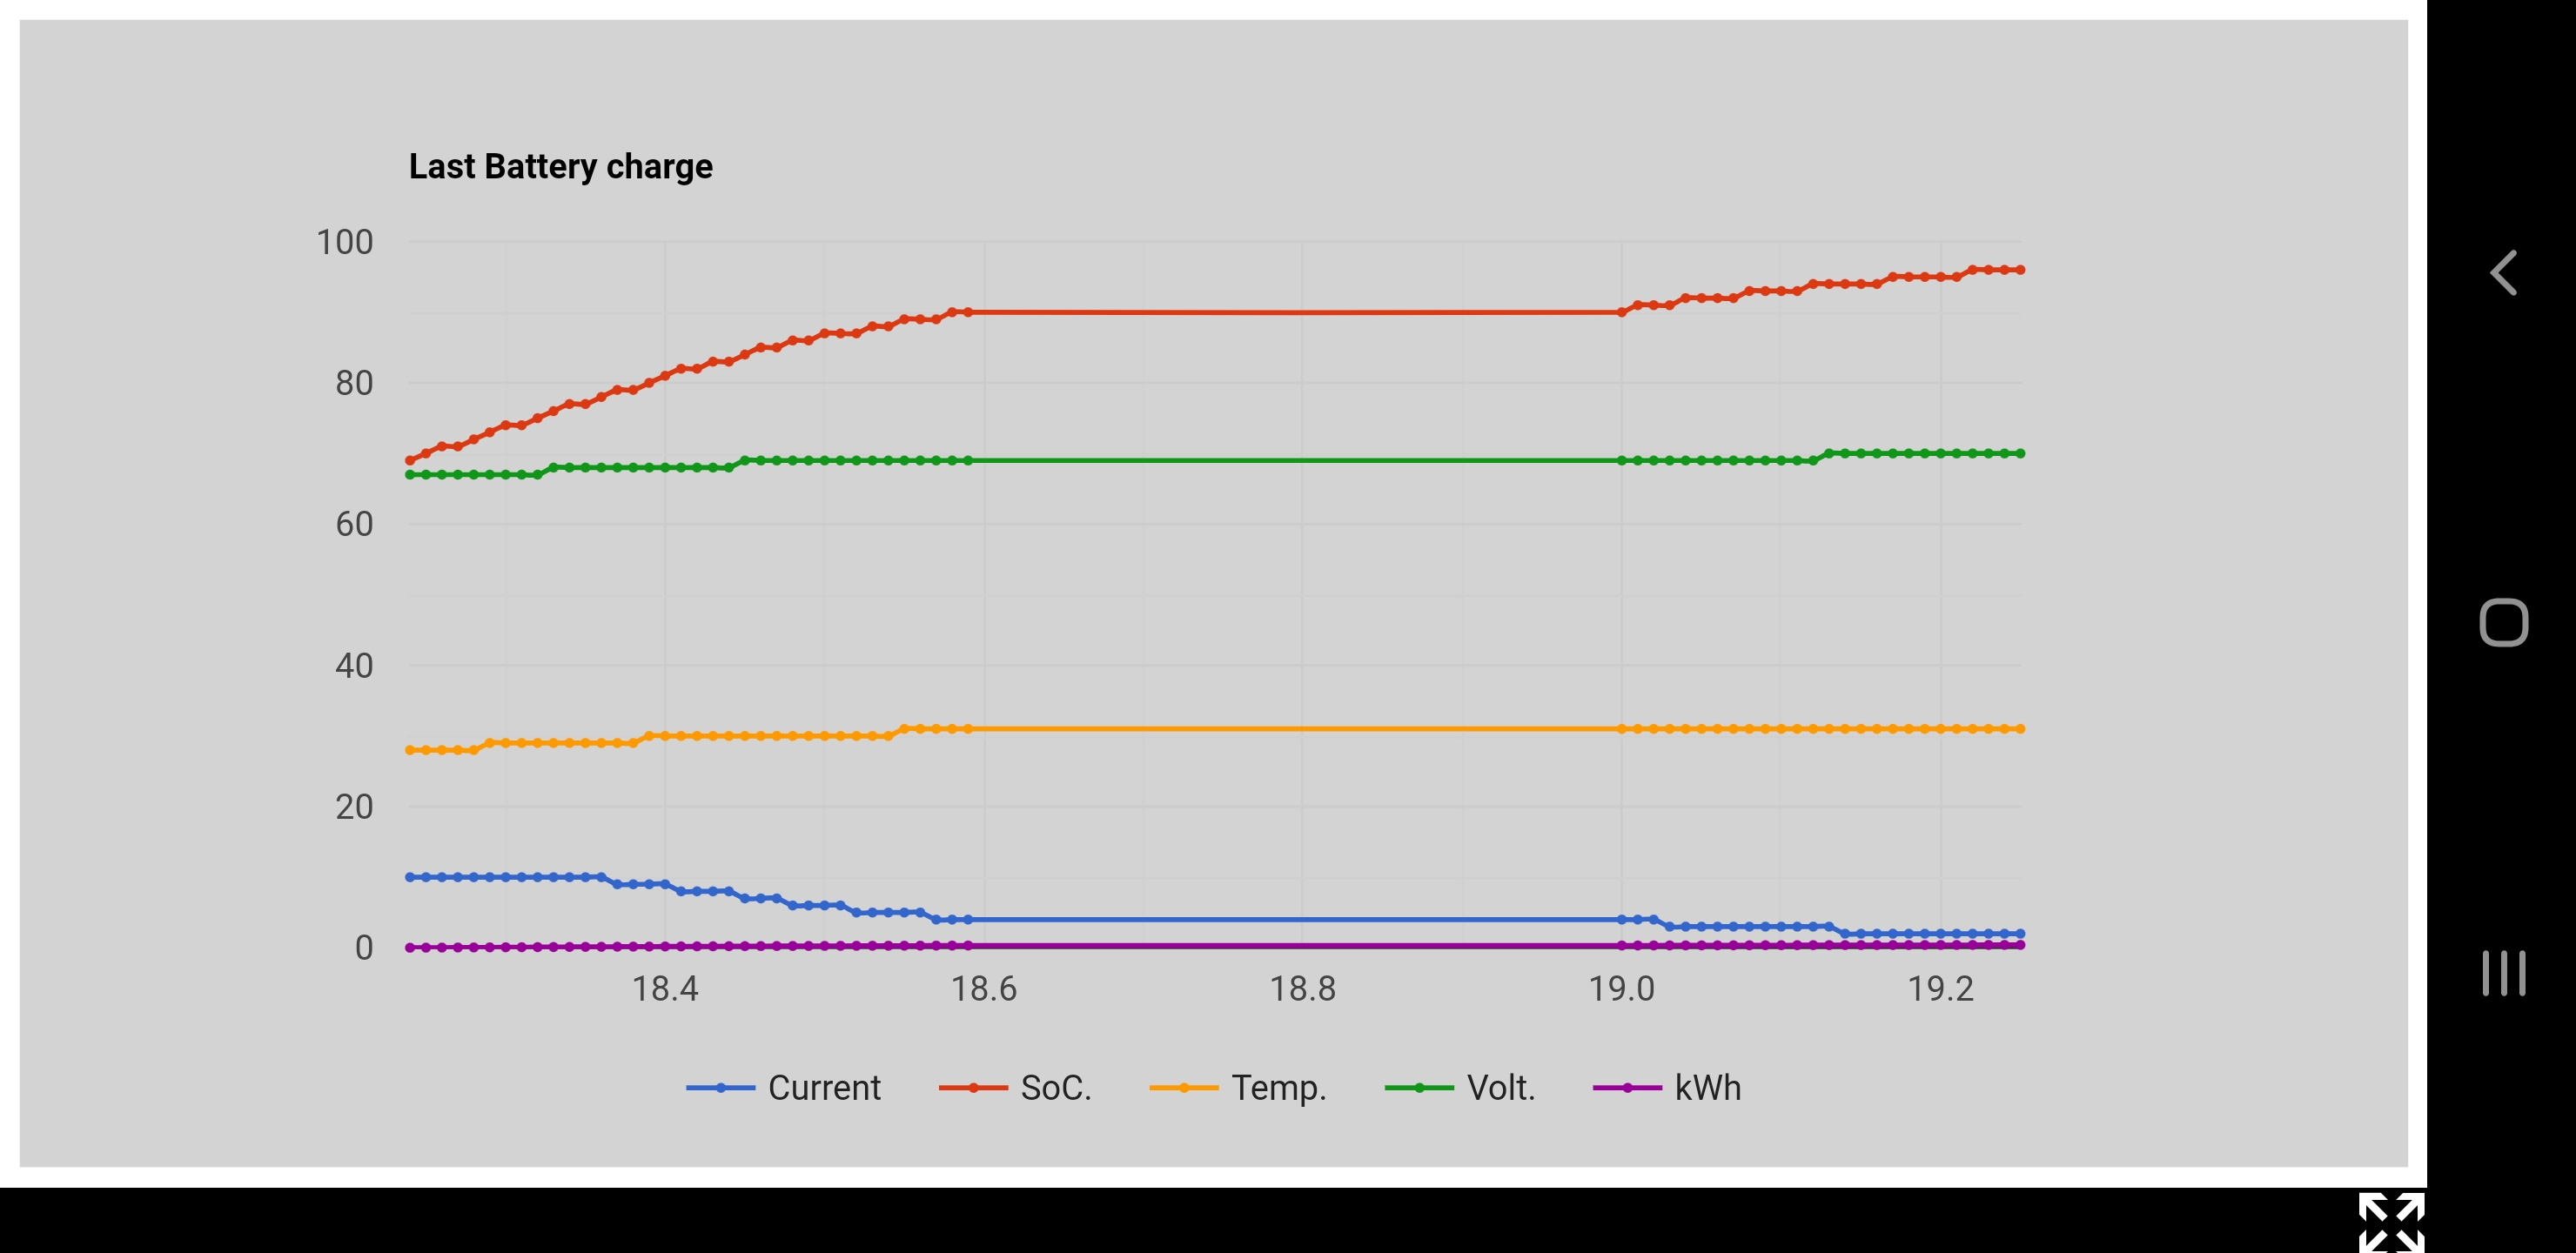
This is a great extension TIMAI2 , Im using in my last project of battery charging status and is amazing and easy to use. However I have an issue that donΒ΄t know how to handle. Look at my chart on X between 18.6 and 19.0


As you can see my X axis would show hours and minutes, but as the input values only can be numbers I decide to convert HH:mm to HH.mm, this works for all minutes except 60 to 100 that obiusly donΒ΄t exist so ChartMaker draw a line from 18.6 to 19.0, So my solution is not valid. Do you know how to handle this situation without lost a fast visualitation of the hour and minute in the chart. (so not conver to absolutes minutes or such ) . Many thanks in advance TIMAI2,

Quickest fix would be to divide the mm by 60...if you want to stick with HH.mm...however,

If you look at the documentation for line chart, you will see that you can format dates/times for values (hAxis.format or vAxis.format)

1 Like

Hello TIMAI2, thanks for your faster answer and your time looking in this.
Sorry but following your sugestion, I try all the option that the Google Chart documentation and ICU parameters suggest for time format but without success, always I add the extraOption for time format to the block, empty chart, no lines. Or the imput numeric values or the string I use for extraoption are wrong.
I made a sample with your demo app:


with few of the extraoption strings I have try.

Please can you open my eyes at what Im doing wrong ?

I'll have to have a look at this.

It is possible that the google chart is expecting "date numbers" in order to format them....

On re-reading, the hAxis.format feature only affects the axis labels and not the data. I will keep looking, there should be a way....

Have a good read here:
https://developers.google.com/chart/interactive/docs/datesandtimes

Hi, your comment about hAxis.format have sense with observation. Reading your link give an idea and this works, more or less as I espect:


So Resuming is only a question of correct formating data time in the list of inputs of the extension block.

Thanks TIMAI2 for pointme in the right direction, thanks for your great extension and support.
ML

1 Like

Hi, The chart now shows "web page not available" in webviewer. Even after switch on the internet. Why is that?

I am guessing it worked before? What have you changed ?

I have just tested my demo and that is working OK.

My question is, is the HTML cached in the privateDir?

/data/user/0/<packageName>/cache/...html

See here:
https://developer.android.com/reference/java/io/File#createTempFile(java.lang.String,%20java.lang.String)

Ok, but there are different temporary-file directories .
(e.g. in the β†’ ASD or in the β†’ privateDir )

The temp-file method is managed by the java system, it would be okay to use it I guess.

It got fix after using custom webwiew. Now it is working ok.

1 Like

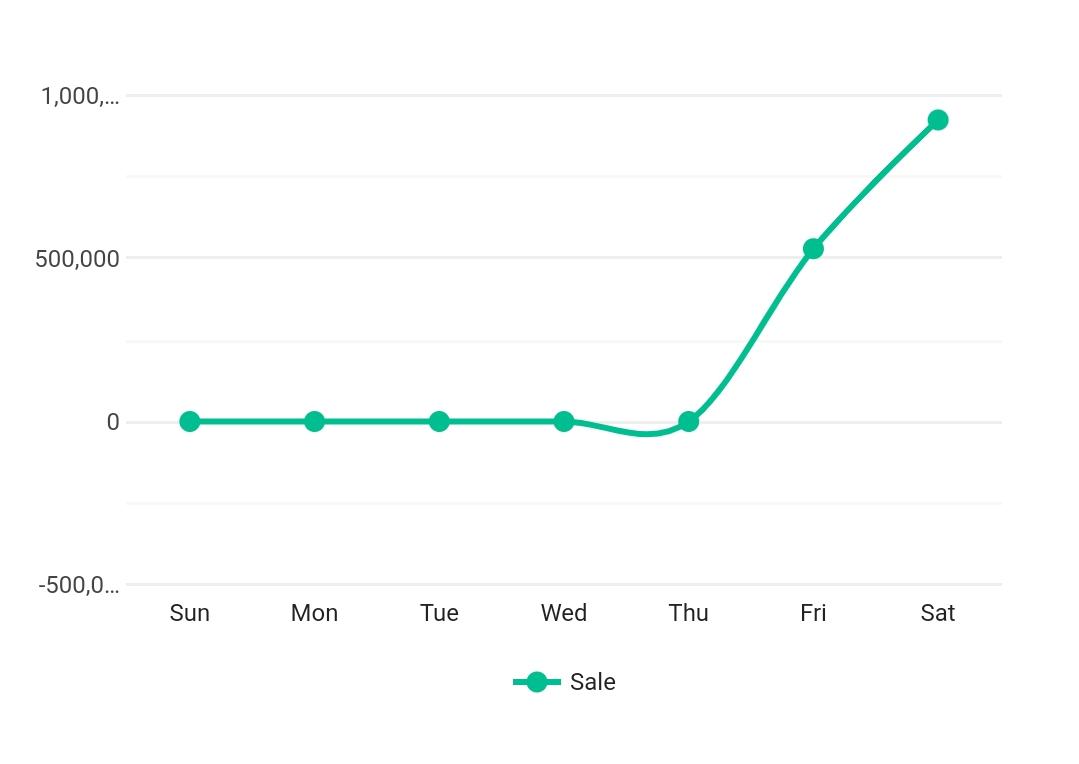
Also, how can i prevent negative value from the y index of line chart?. I am creating a sales graph with y axis as sales value and x axis as period of time. I have to make the zero as the base value. how can i do that?

Fide_app, if your sales values really never take negative values, do you have this extraOption ?
curveType:'function'

Remove this extraOption and give feedback...

@TIMAI2 I have a little suggestion for you. Is it possible to add an block After ChartMakerPlus1.ChartGenerated as it takes some time to generate the chart.

I will add it to my list of things to do.

1 Like

Thanks :pray:t2:

I removed the curve but still it shows negative values.