Thank you for your example of dual Y axes,I had seen it above and been playing with it.
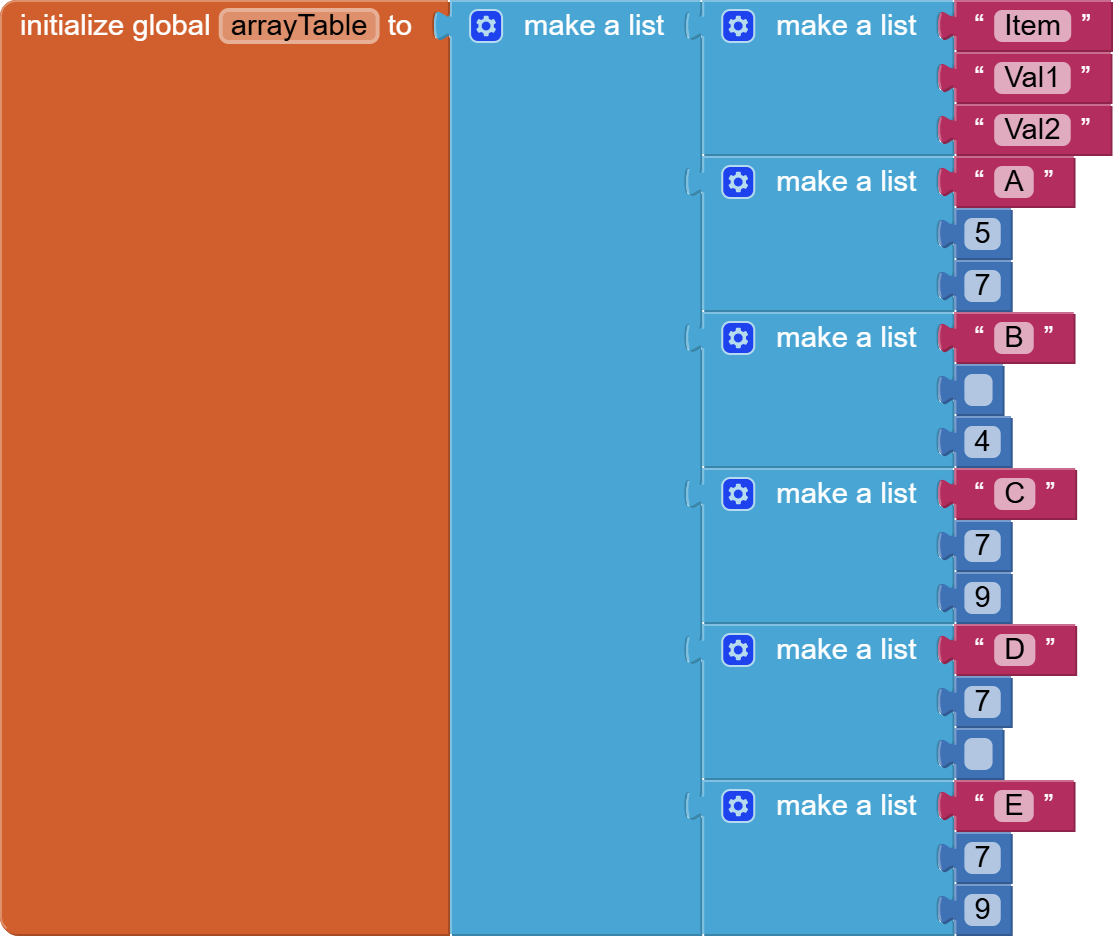
The example shows a graph that works. In my data set, the "Item" is my date/times. The Val1 might be Phosphates, and Val2 might be Dose. But the data is has gaps which makes the graph not correct. If I modify your example with a few more "items" to allow a test to be shown. If Val1 does not have a value on B, or Val 2 does not have a value on D, how does not need to be done?
In my data, the phosphates would be entered at different times than the dose so the there will be more items across the bottom but the data points are not on same date/time.