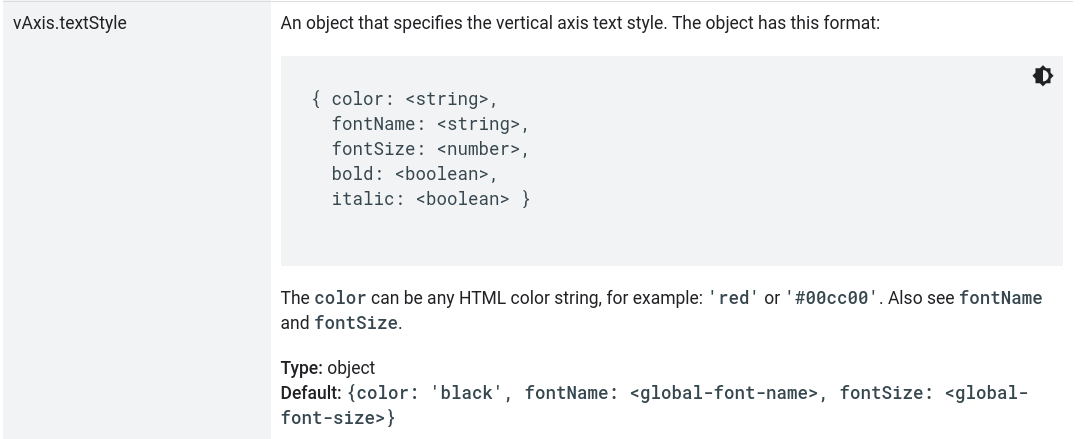
i have a question,
how can i change font size of axis?
for example,
5
4
3
2
1
...1 2 3 4 5 6 7
these axis text font size (+title size). i cannot understand even if i read google chart tutorial..
can i insert into options or css part?
Hi! i'm using your extension and it looks very useful, i have a little problem with my container and zoom and i can't get rid of this.
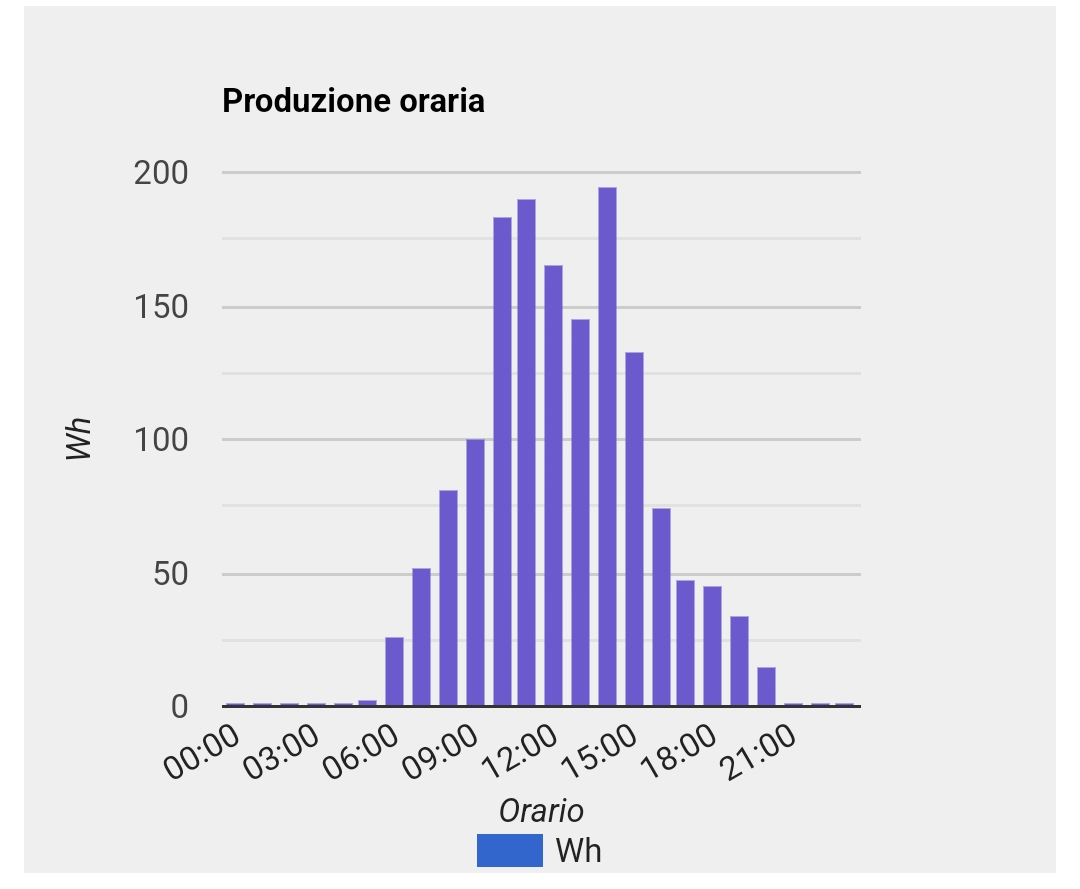
If there is no zoom the chart looks like this
Sorry i exposed the problem in a confused way.
It does the zoom but the container doesen't allow me to scroll in the zoommed page, the result is that the content i want to zoom result truncated.
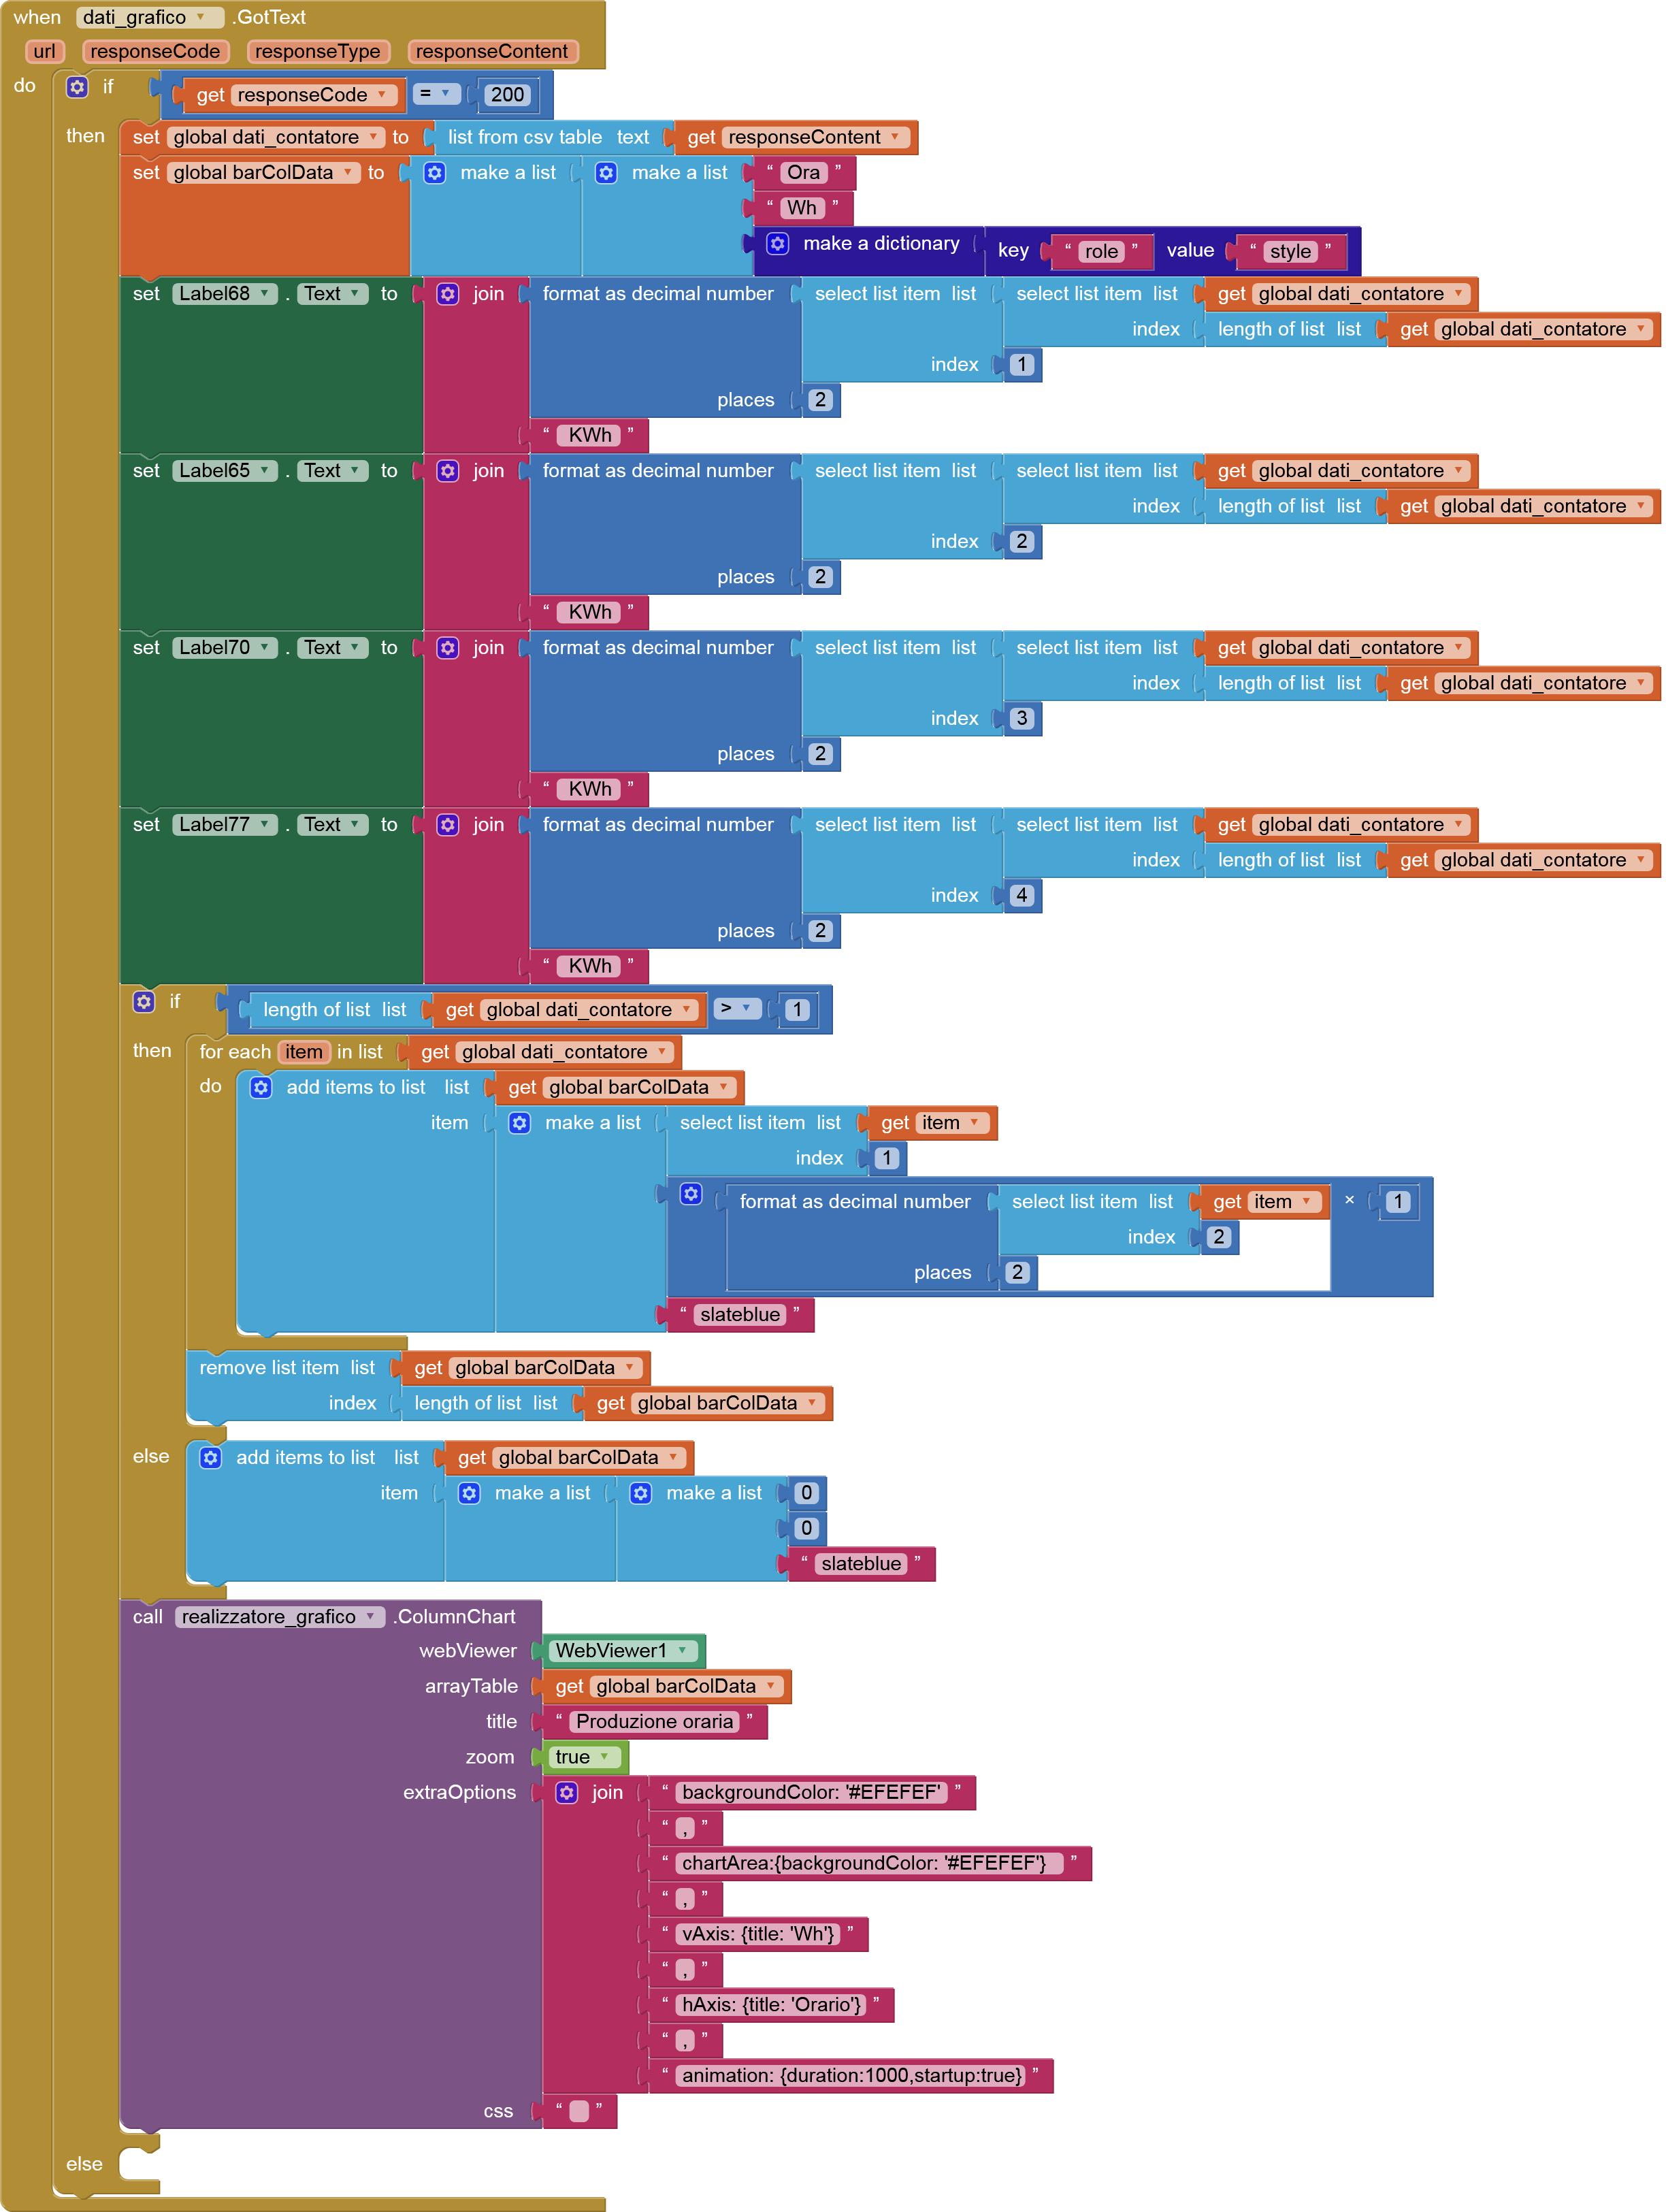
this is the block
I would have to build up an example chart to test this out.
You could try adjusting the chart size using css. The chart is in a div with id = col_chart set in the extension width = 100% and height = 100%. Change these to pixels instead of percentages...
Sorry but i didn't understand were and how i have to change the pixels instead of percentage
I tried to build an app with the graph only, the WebViewer show data and i can move in the zoomed window normally.
In my application there is a big vertical scroll arrangement (width and height set to "fill parent") , inside of it there is a block with some data and, below that, my graph, but in this case the window is blocked.
if i set automatic size in a blank project, it work fine, but if set that in my project, graph don't even show, i have to set a fixed height to make it visible.
I have just tested the demo aia project from the first post in this topic, on the column chart with zoom set to true. Using companion app, the graph zooms with a two finger gesture, and scrolls around with a one finger gesture. Therefore unsure as to where your issue lies?
I found the issue, if you have the webviewer in a container, and the sum of the container height is over 100% (in my case the first box have height 70% and graph 50%, scrollable), the movement inside the zoommed graph is blocked.
i hope this video describes well the error
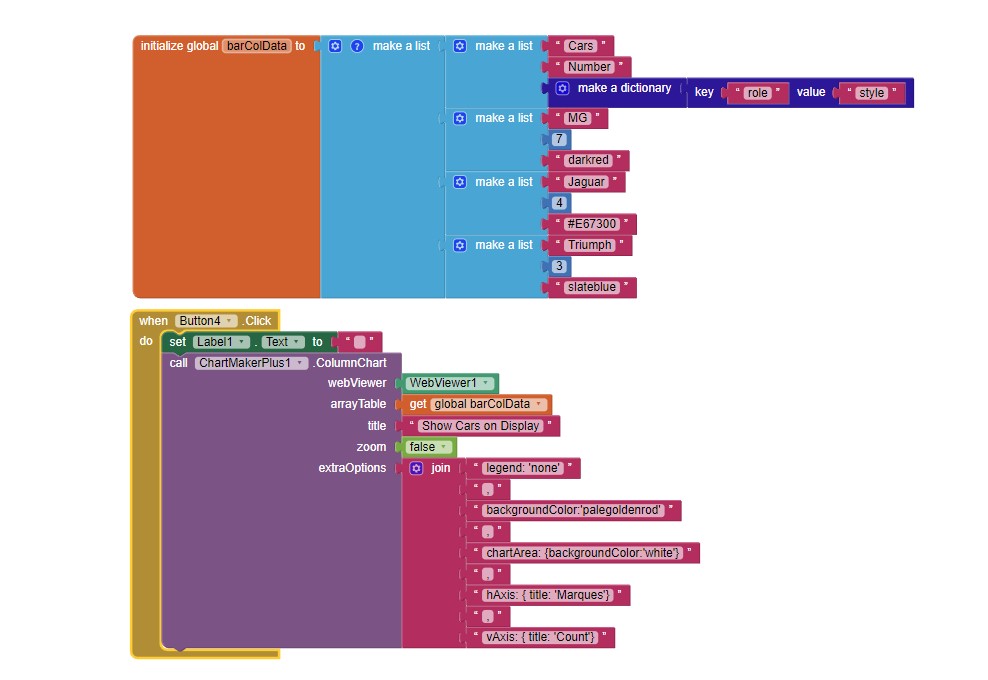
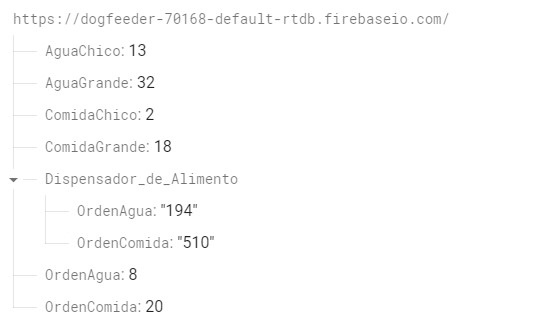
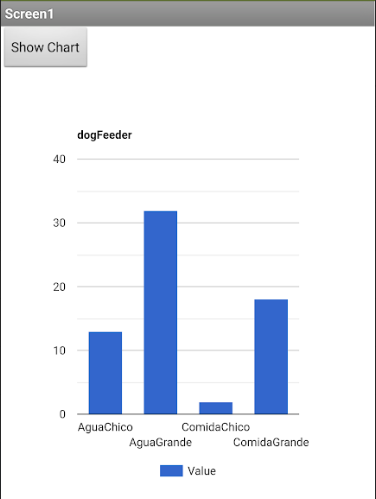
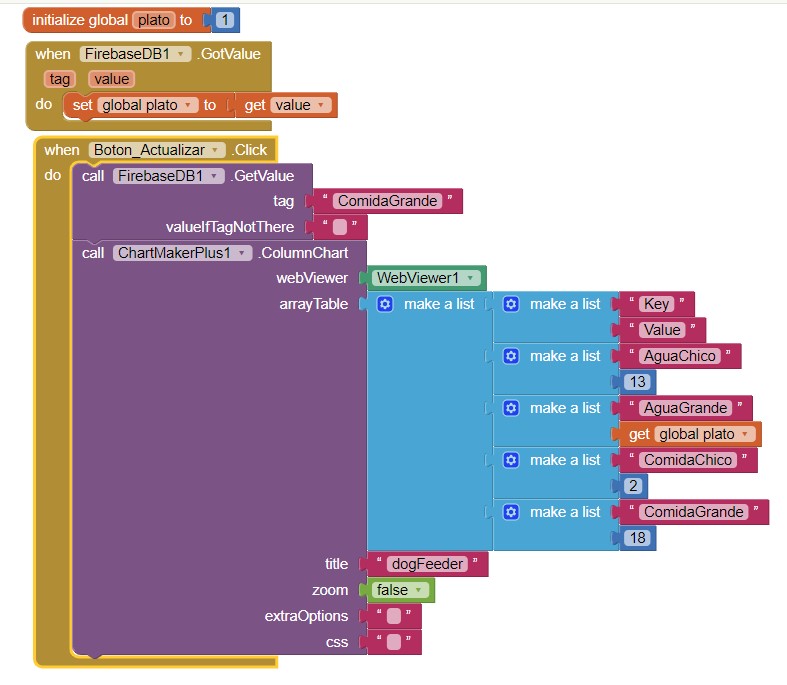
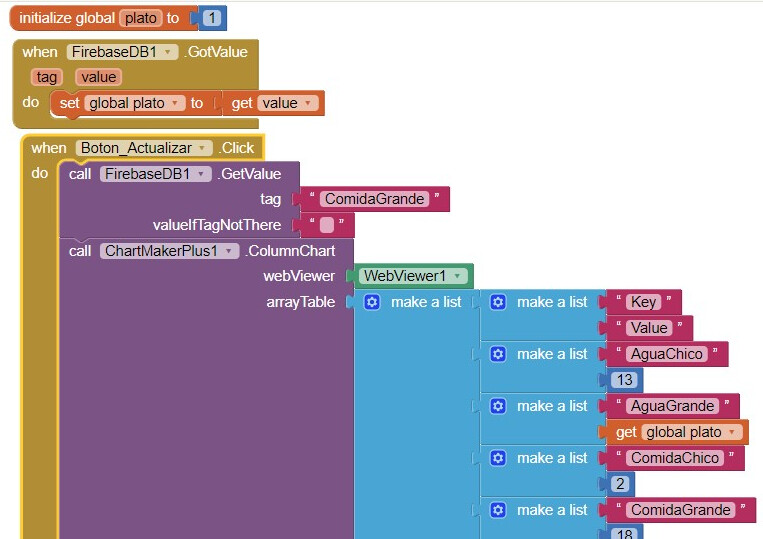
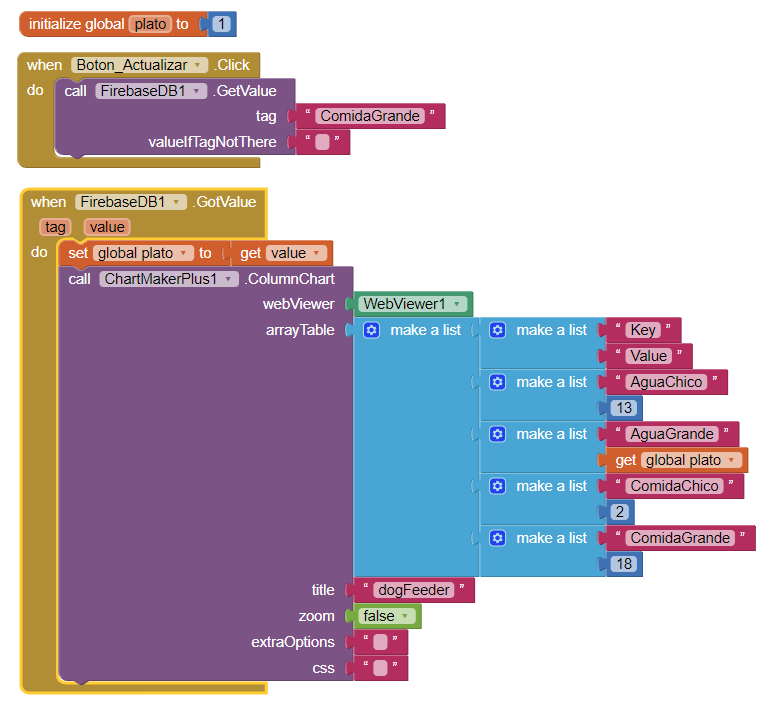
Hi! first of all i speak spanish, so i apologize if my english is not good enough. I tried to make a column chart with data from firebase, but it doesn't seems to work, i swear i read all the documentation and try by myself but honestly i can't. i know my database is setted correctly. My problems are only the blocks. i just need to do a column chart with 4 columns that updates when i touch a button, and it should display the 4 int values into the columns, i know my problem is in the "list" part but i tried so many ways, so i return to the begining for this question, what should i do from this cap to do what i want? sorry if i am asking you something stupid. i need to siplay in the columns the first 4 tags from firebase, and keep it updated when i touched a button.
I started from the base y gave you in the first 2 pics to simplify the help you can bring me, so the first 2 pics i brought you is all i have, now i copy your pics exactly the same and i got the same pic you posted Also i don't have the "firebase blocks" because i thought it was extremely wrong so i delete that. i have my token and my firebase link correctly setted in the "designer" part, i know it because i can send int data from app inventor to firebase.
Edit: thanks for your soon reply.
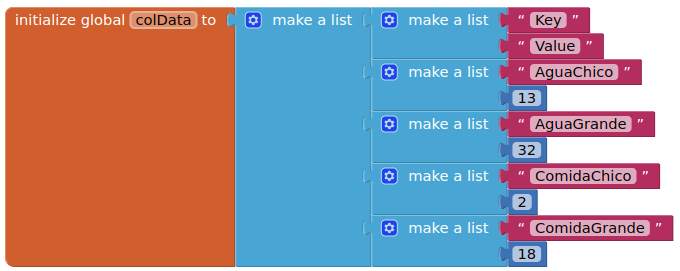
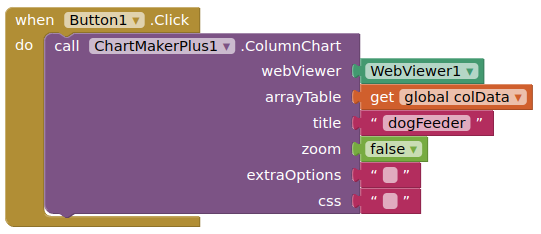
Hi ! Me again, i tried my best but i still struggling with this, i came to an old post in this thread, and i intend to copy that, so this is the best i´ve got, but still not working, first pic it´s my blocks, second the image i tried to copy (this image it´s in some point in this thread). i hope someone can help me, thanks again. also i know my blocks are extremely wrong.
sorry for that. It would be under the set "global plato" event, right? doing that, my chart doesn´t show any number in the "AguaGrande" column, it´s only an empty column. So with that modification, this is what i have.


 , i'll try it out!