Thanks for this nice extension !
I need to make a scatter plot but this is not possible right now. Will be possible to add this in a future version?
Possible, but no plans for it...you could make one directly with google charts, and the built-in Chart component in AI2 will be coming soon....
Thanks for the fantastic extension!
Now, I’m trying to plot real-time data from a sensor. While this does work in principle, repeatedly calling ChartMakerPlus.LineChart will cause the chart to “flicker” as an artifact of re-rendering the chart in WebViewer.
Is there maybe a way to avoid this? Any help would be appreciated!
This is (in principle) what I am trying to achieve: https://webdeasy.de/wp-content/uploads/2020/06/javascript-live-chart.mp4
Minimal (coarse) example:
I have made several attempts to handle real time data. Whilst an in html javascript update of data seems to work well, providing a feed of realtime data is less than successful.
You may have more luck with (google) searches on the subject, but there will always be a short delay while the chart is turned around at the server.
You could try using High Charts, where you can bring down all the javascript libraries to the app.
Unfortunately, the new Chart component didn't make it into the latest nb189 release 
Thanks for your instantaneous reply! I’ll look into that.
Great job @TIMAI2 !
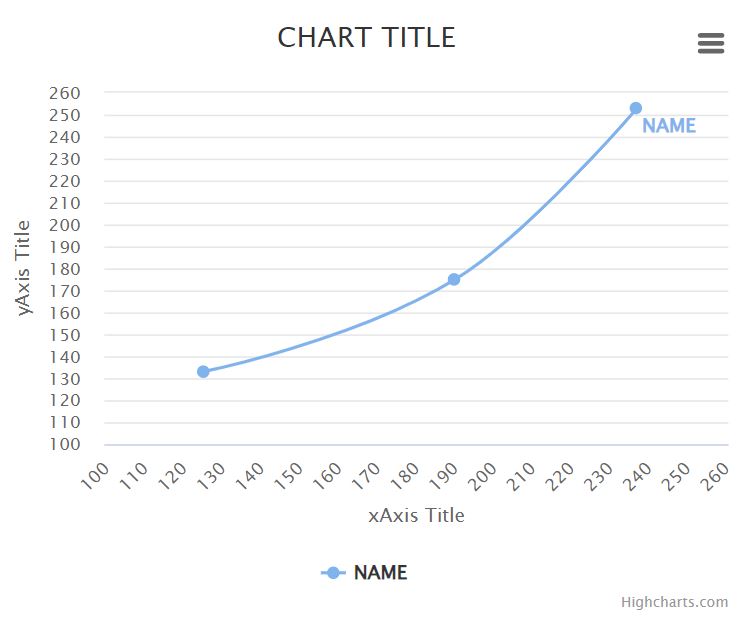
Before I knew about this extension, I made a (Sp)Line chart with HighCharts.
But now I would like to convert it to your extension.
I went through the google docs but I'm totally lost.
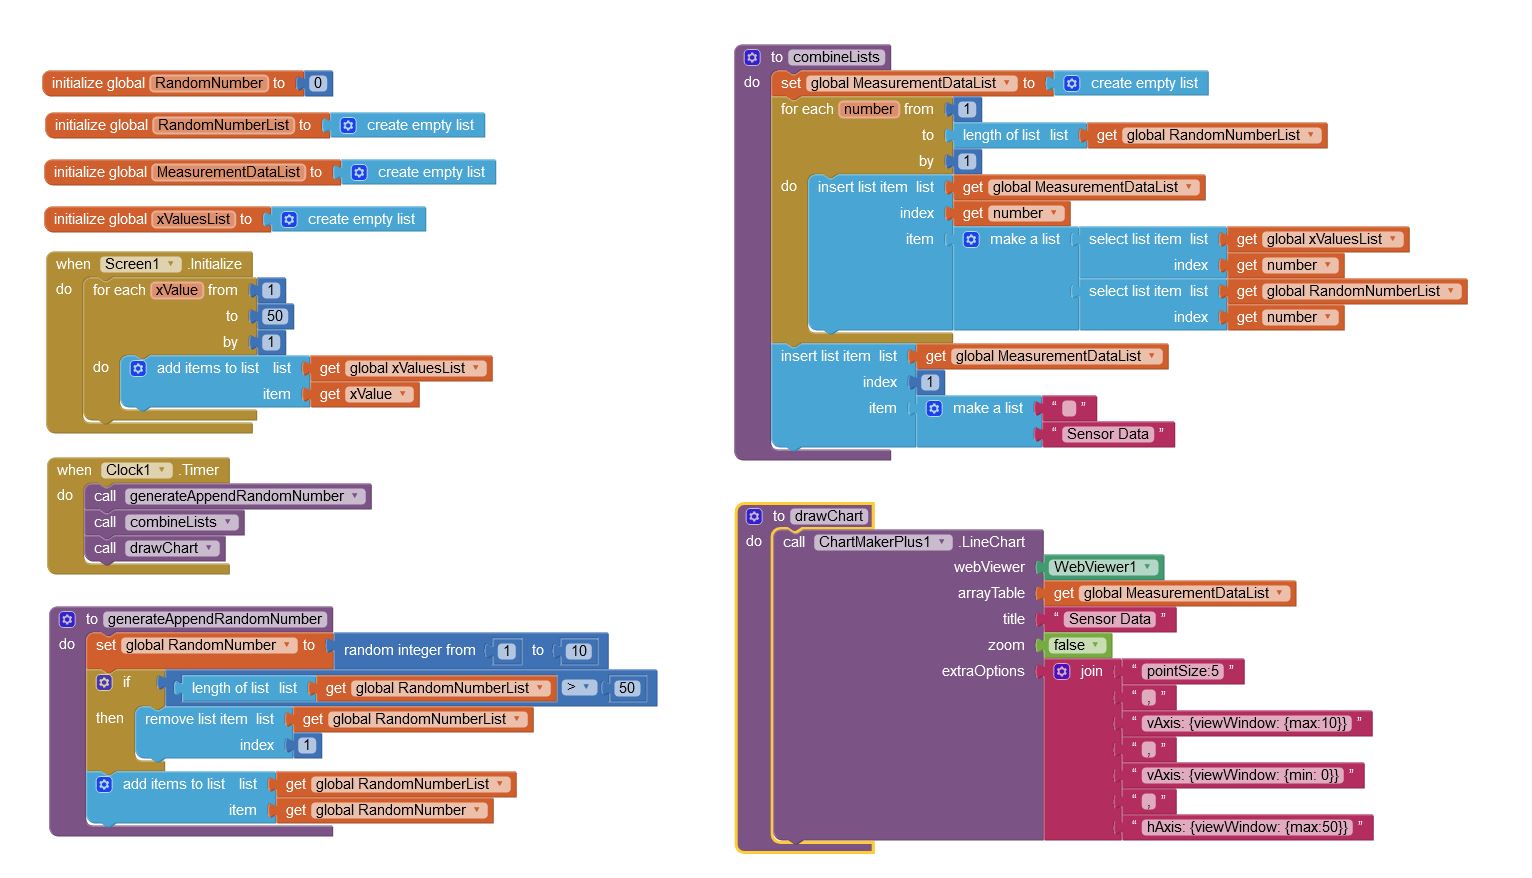
Could somebody please help me with the blocks for the arrayTable (Line Data) and which options to plug in to extraOptions?
Here is the html code and a screen shot of what I have made in HighCharts, so that you can see what I want to get to:
<!DOCTYPE html>
<html>
<head>
	<script src="https://code.highcharts.com/highcharts.js"></script>
	<script src="https://code.highcharts.com/modules/series-label.js"></script>
	<script src="https://code.highcharts.com/modules/exporting.js"></script>
	<script src="https://code.highcharts.com/modules/export-data.js"></script>
	<script src="https://code.highcharts.com/modules/accessibility.js"></script>
</head>
<body>

	<div id="container1" style="width:50%"></div>

	<script>
		Highcharts.chart('container1', {
			chart: {
				type: 'spline',
				height: 80  + '%'
			},
			title: {
				text: 'CHART TITLE'
			},
			xAxis: {
				title: {
					text: 'xAxis Title'
				},
				type: 'category',
				min: 100,
				max: 260,
				tickInterval: 10
			},
			yAxis: {
				title: {
					text: 'yAxis Title'
				},
				labels: {
					formatter: function () {
						return this.value;
					}
				},
				min: 100,
				max: 260,
				tickInterval: 10
			},

			series: [{
				name: 'NAME',
				data: [[125, 133],[190, 175],[237, 253]]
			}],
		});
	</script>

</body>
</html>
Many thanks in advance!
Walter
I will do you examples using the native Charts component, and ChartMakerPlus.
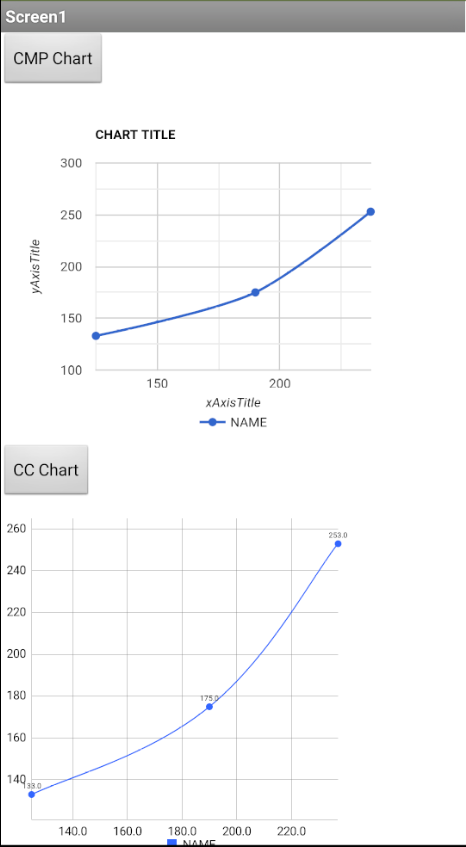
chartExamples.aia (13.0 KB)
You can play around with the settings of both charts to improve your output
That's great TIMAI2! Thank you so much for your swift reply!
Wow!!!
Small question: google charts has this script:
"....com/charts/loader.js"
Is this loader.js imbedded in your extension code so that an internet connection is not required?
I guess so because if I disable connection, the chart is still showing.
... maybe it is in the cache? (I don't want to delete my data to find out)
No, loader.js is on the server side, it cannot be loaded client side, therefore an internet connection is required to build a google chart.
Thanks!
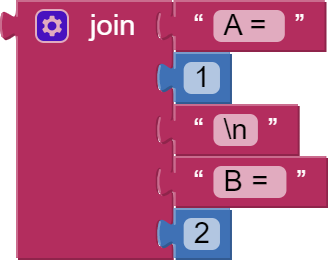
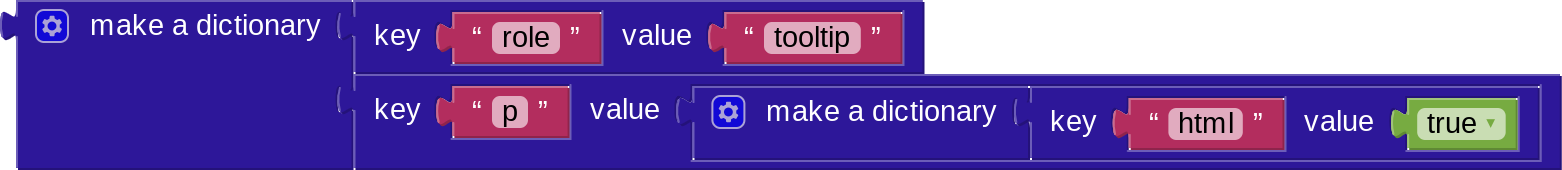
Now I'm stuck on trying to get a line break in my tooltip:
I also tried in the extraOptions:

But nothing worked, only no chart when "\n" or when "< br >" I get it literally in the text of the tooltip.
It is tricky, but can be done.
- in extraOptions add

- In your data, in the "header" list, add another data column with this(for the tooltips data):
-
Add another item for each tooltip in your data.
-
Use
<br>for line returns
@TIMAI2
Would it be possible to embed this script in the extension so that no internet connection is needed?
Or would you consider posting your last java file so that we can add the script and compilate the extension for ourselves?
Google Charts requires an internet connection, you cannot install the loader.js locally.
I already advised you of this above:
The AI2 Chart component works locally, but is not as fully featured....
That's a pity.
hello, thank you very much for that work
i am asking if i can make timeline chart with this extension the same like google time line charts
example from google docs..
==============================================================
google.charts.load('current', {'packages':['timeline']});
google.charts.setOnLoadCallback(drawChart);
function drawChart() {
  var data = google.visualization.arrayToDataTable([
    ['Activity', 'Start Time', 'End Time'],
    ['Sleep',
     new Date(2014, 10, 15, 0, 30),
     new Date(2014, 10, 15, 6, 30)],
    ['Eat Breakfast',
     new Date(2014, 10, 15, 6, 45),
     new Date(2014, 10, 15, 7)],
    ['Get Ready',
     new Date(2014, 10, 15, 7, 4),
     new Date(2014, 10, 15, 7, 30)],
    ['Commute To Work',
     new Date(2014, 10, 15, 7, 30),
     new Date(2014, 10, 15, 8, 30)],
    ['Work',
     new Date(2014, 10, 15, 8, 30),
     new Date(2014, 10, 15, 17)],
    ['Commute Home',
     new Date(2014, 10,  15, 17),
     new Date(2014, 10,  15, 18)],
    ['Gym',
     new Date(2014, 10, 15, 18),
     new Date(2014, 10,  15, 18, 45)],
    ['Eat Dinner',
     new Date(2014, 10,  15, 19),
     new Date(2014, 10,  15, 20)],
    ['Get Ready For Bed',
     new Date(2014, 10,  15, 21),
     new Date(2014, 10,  15, 22)]
  ]);

  var options = {
    height: 450,
  };

  var chart = new google.visualization.Timeline(document.getElementById('chart_div'));

  chart.draw(data, options);
}
====================================================================
here the array of times is made like that ['Get Ready For Bed',
new Date(2014, 10, 15, 21),
new Date(2014, 10, 15, 22)]
is that mean to make the data line table should contain the word new Date ?
what will be the extra option i need to put
accully my data will be datetime for sensor that measures ph every 4 hours this data is saved in firebase database so it easy to get it formated as keys and values where the keys will be the time but should it be in
new Date(2014, 10, 15, 21)
this formate ?
You will have to use Google Charts directly for that, in a webviewer.
1 Like