Your second extension really rocked the world @TIMAI2 
Five Star for your extension :


Wow ! Superb extension ! Keep it up @TIMAI2 ! 


For your extension - 


For you - 


Your marks -  /
/ 
Your extension's marks -  /
/ 
(added to FAQ)
Great chart extension!!! Maybe can just help me with something please on this extension.
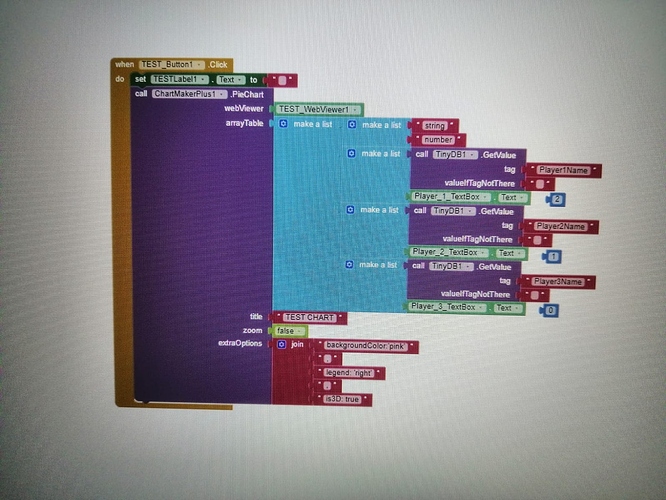
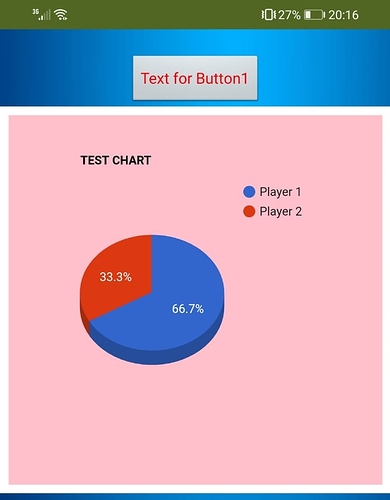
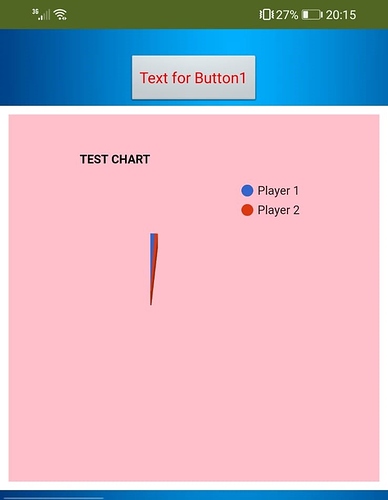
Attached find my blocks and photos of pie chart not working correctly and working correctly.
The pie chart will be reading the number in the textbox which it is doing but not using my whole pie chart, only uses the amount %.
If I use the blue math block instead of text box then it works perfect.
I need the full pie please with text boxes
It is a good point.
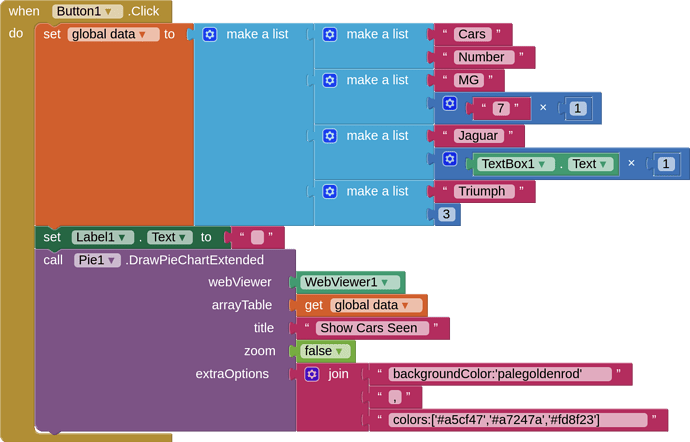
The extension is expecting numbers AS numbers, therefore you have to convert the textbox item (which is a string) to a number. You do this like this:

or

AppInventor doesn't mind if a number is presented as a text(string), it handles the conversion, java/javascript is less forgiving. You can see the difference in these two lists:
Numbers as numbers:
[
["Cars", "Number"],
["MG", 7],
["Jaguar", 4],
["Triumph", 3]
]
Numbers as texts (strings):
[
["Cars", "Number"],
["MG", "7"],
["Jaguar", "4"],
["Triumph", "3"]
]
to make the pie chart:
Also, in the first list of lists in your blocks you have "string" and "number". In this extension the first list does not define the type, it defines the headers as you can see in the two above examples ["Cars","Number"]. The type (string or number) is defined by what is presented in the rows. A pie chart expects the first item in the row to be a string, and the second to be a number.
I hope that helps to explain how it works.
the x1 worked perfectly!!! Thank you so much
note on the "string" part as well.

Thank you for the great extension!
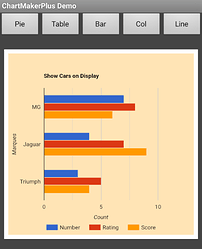
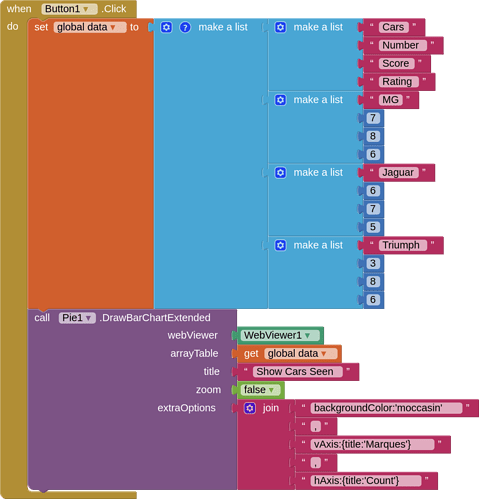
Can I also know how do I write the block so that I can have the left bar chart shown earlier?
Hi @TIMAI2 thank you for the blocks.
Was wondering if I could incorporate this with TinyDB to show info (e.g highest score), displaying the latest 10 scores using the bar chart?
Of course you can 
Thanks! Was wondering if you have any blocks that I can refer to? I just started working on MIT app for a school project and saw your extension and thought it'll be cool to combine both TinyDB and the bar chart!
All you have to do is extract the data from your tinydb tag/s and place it in a list format that works for a bar chart. You have everything you need. Have a go.
Hi, @TIMAI2
I am currently using the doughnut Chart with the link you have added. Everything working great, maybe you can help me with putting the title in the center of the doughnut.
I dont have a picture but dont need picture to explain what I wanna do, it basically easy to understand.
I just wanna know do i add the extras by the title area or by the extras area, and what is the best html to type in to make it happen.
many thanks
See if there is anything here that works for you:
Alternatively you could try this method:
then place the image on a button and set the title to the button text.....
