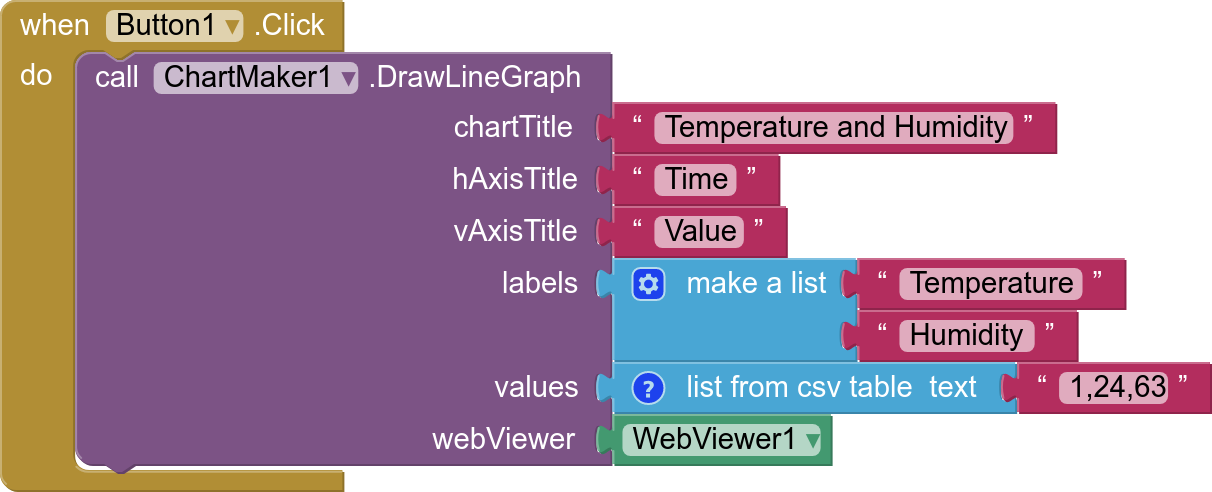
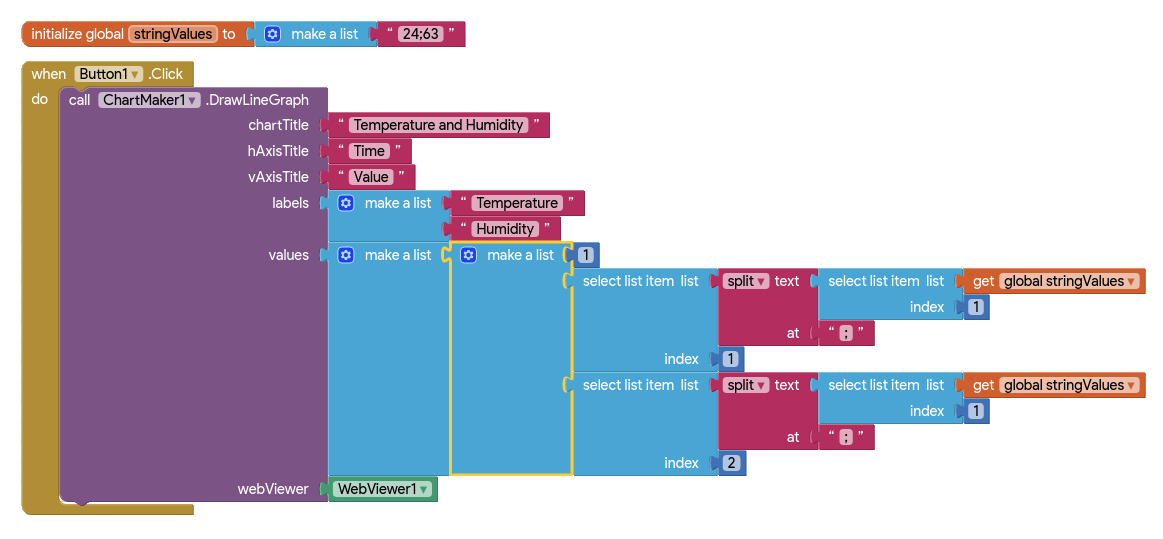
This is how you need to present your data to the Chartmaker:
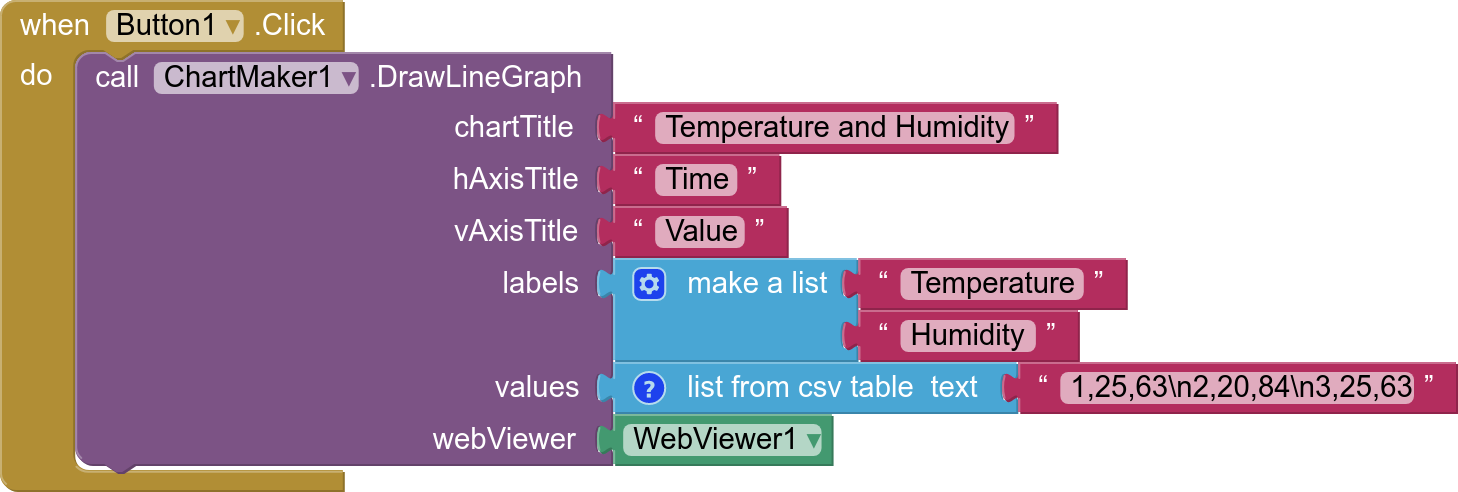
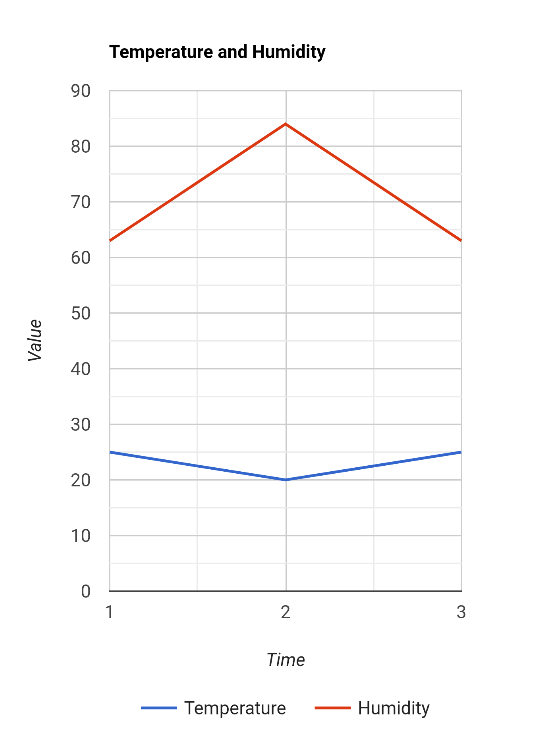
and for several values:
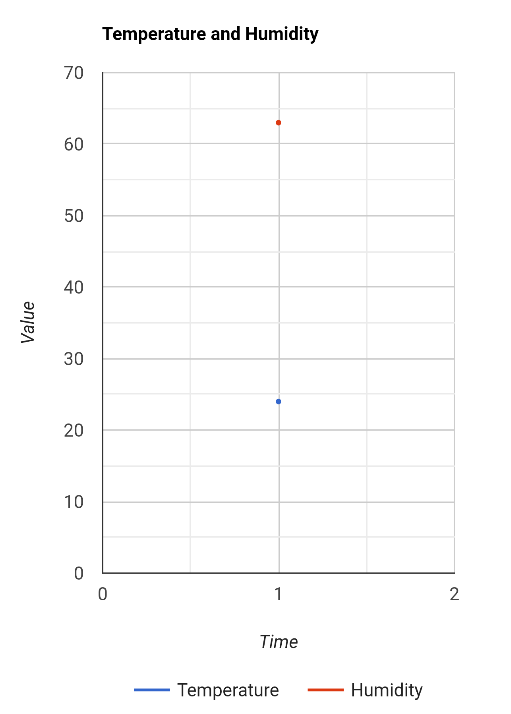
and to chart your two single values: