You will need to do a find and replace on it then...
maybe I didn't explain it very well, but the Arduino Serial.println is doing a ''return to line '', that do not appears on the app inventor side : the data looks like that really in a list
(0,25,0)
(1,25,0 )
(2,26,0)
(3,26,0)
(4,25,0)
Just run some text manipulation blocks on the data until you get it into the correct format/layout. It could be that the "\n" are there but just not showing. You will need to lose the parantheses though.
Alternatively, convert to an AI2 list ?
yet I currently manage to get something almost working by doing this:
But the global List_T is not cleared aech time I got new data, and on the arduino side I need to wait 1second between each line data sending
for example:
(0,25,0)
... wait 1000ms
(1,26,0)
.. wait 1000ms
.....
this just to give time to app inventor to separate each item of the list and avoid them to override each other.... maybe there is a faster solution for app inventor to get array?
Just run some text manipulation blocks on the data until you get it into the correct format/layout. It could be that the
"\n"are there but just not showing. You will need to lose the parantheses though.Alternatively, convert to an AI2 list ?
I believe the format is correct as the data are displayed, the parantheses appear only in the listView but apparently are not present (??!!)
AI2 list? dodn t know yet, but will have a look at it.
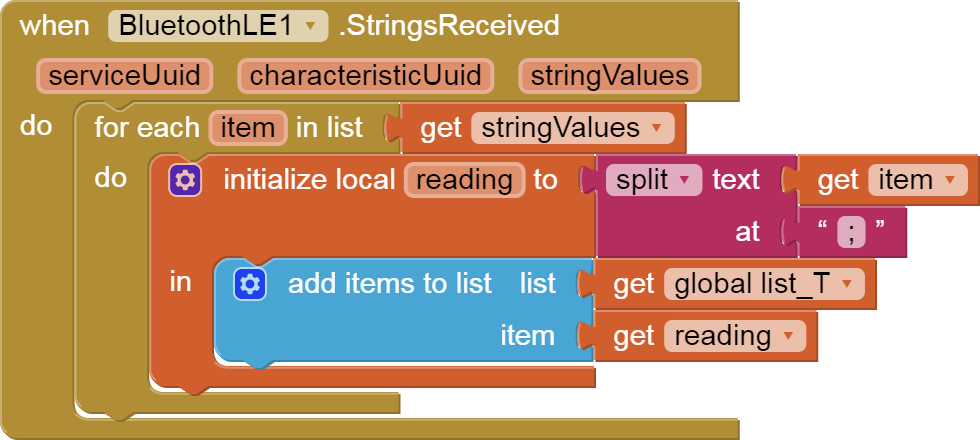
The BLE StringsReceived event is much simpler ...
when BLE StringsReceived
   for each **item** in stringValues
      init local **reading** to split **item** at ';'
         add **reading** to list global **list_T**
      end init local
   end for each
end when BLE StringsReceived
(I assume global list_T is a table, a list of readings, and each reading is the list gotten from a split at ';')
I could code this for you if you
Please download and post each of those event block(s)/procedures here ...
(sample video)
Hi ABG,
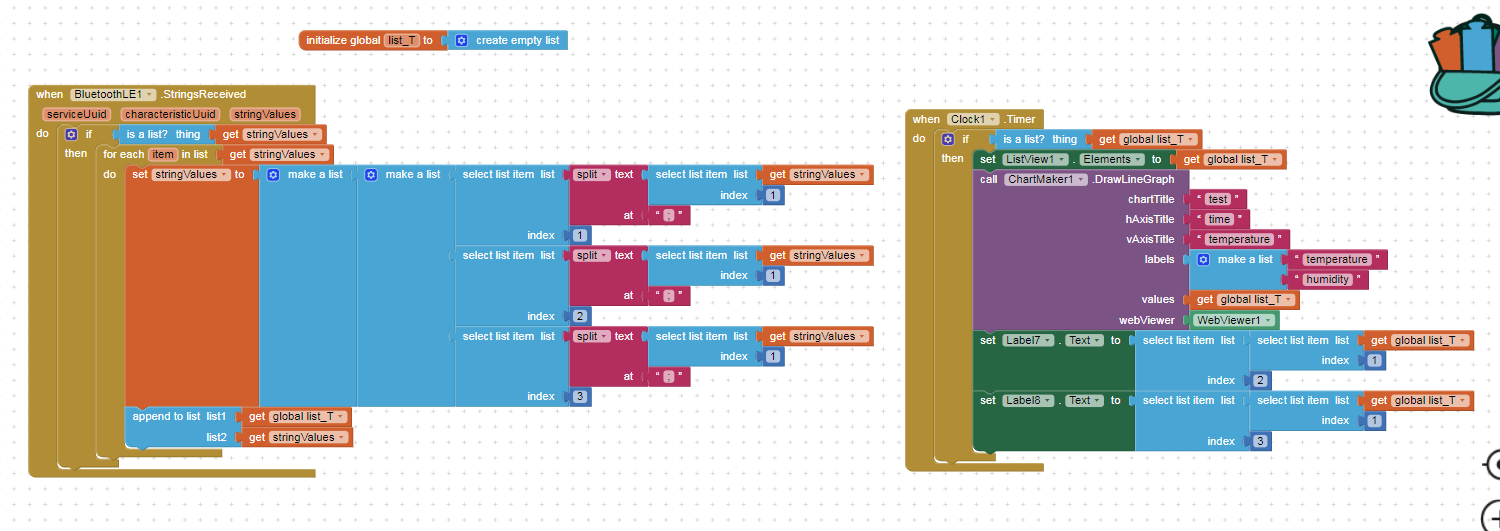
Here is the BLE block, (the timer block is just a display, and it is working for now). Note that the global list_T should be cleared each time I got a new batch of values (I didn' t do it in this screenshot - it may complicate the thing as I tried with "set global List_T -> make empty list" after the "is a list? get string values" but without succes yet). by advance thx for your help.
These are the (draggable) blocks for the code I posted in ChartMaker extension
Again, I assume Chartmaker needs global list_T to be a table (list of lists) as input.
Hi, I will have a try and let your know ... I already tried something closeby and it was not working (but was working on another project where I just got a line with 3 values separated by ";")
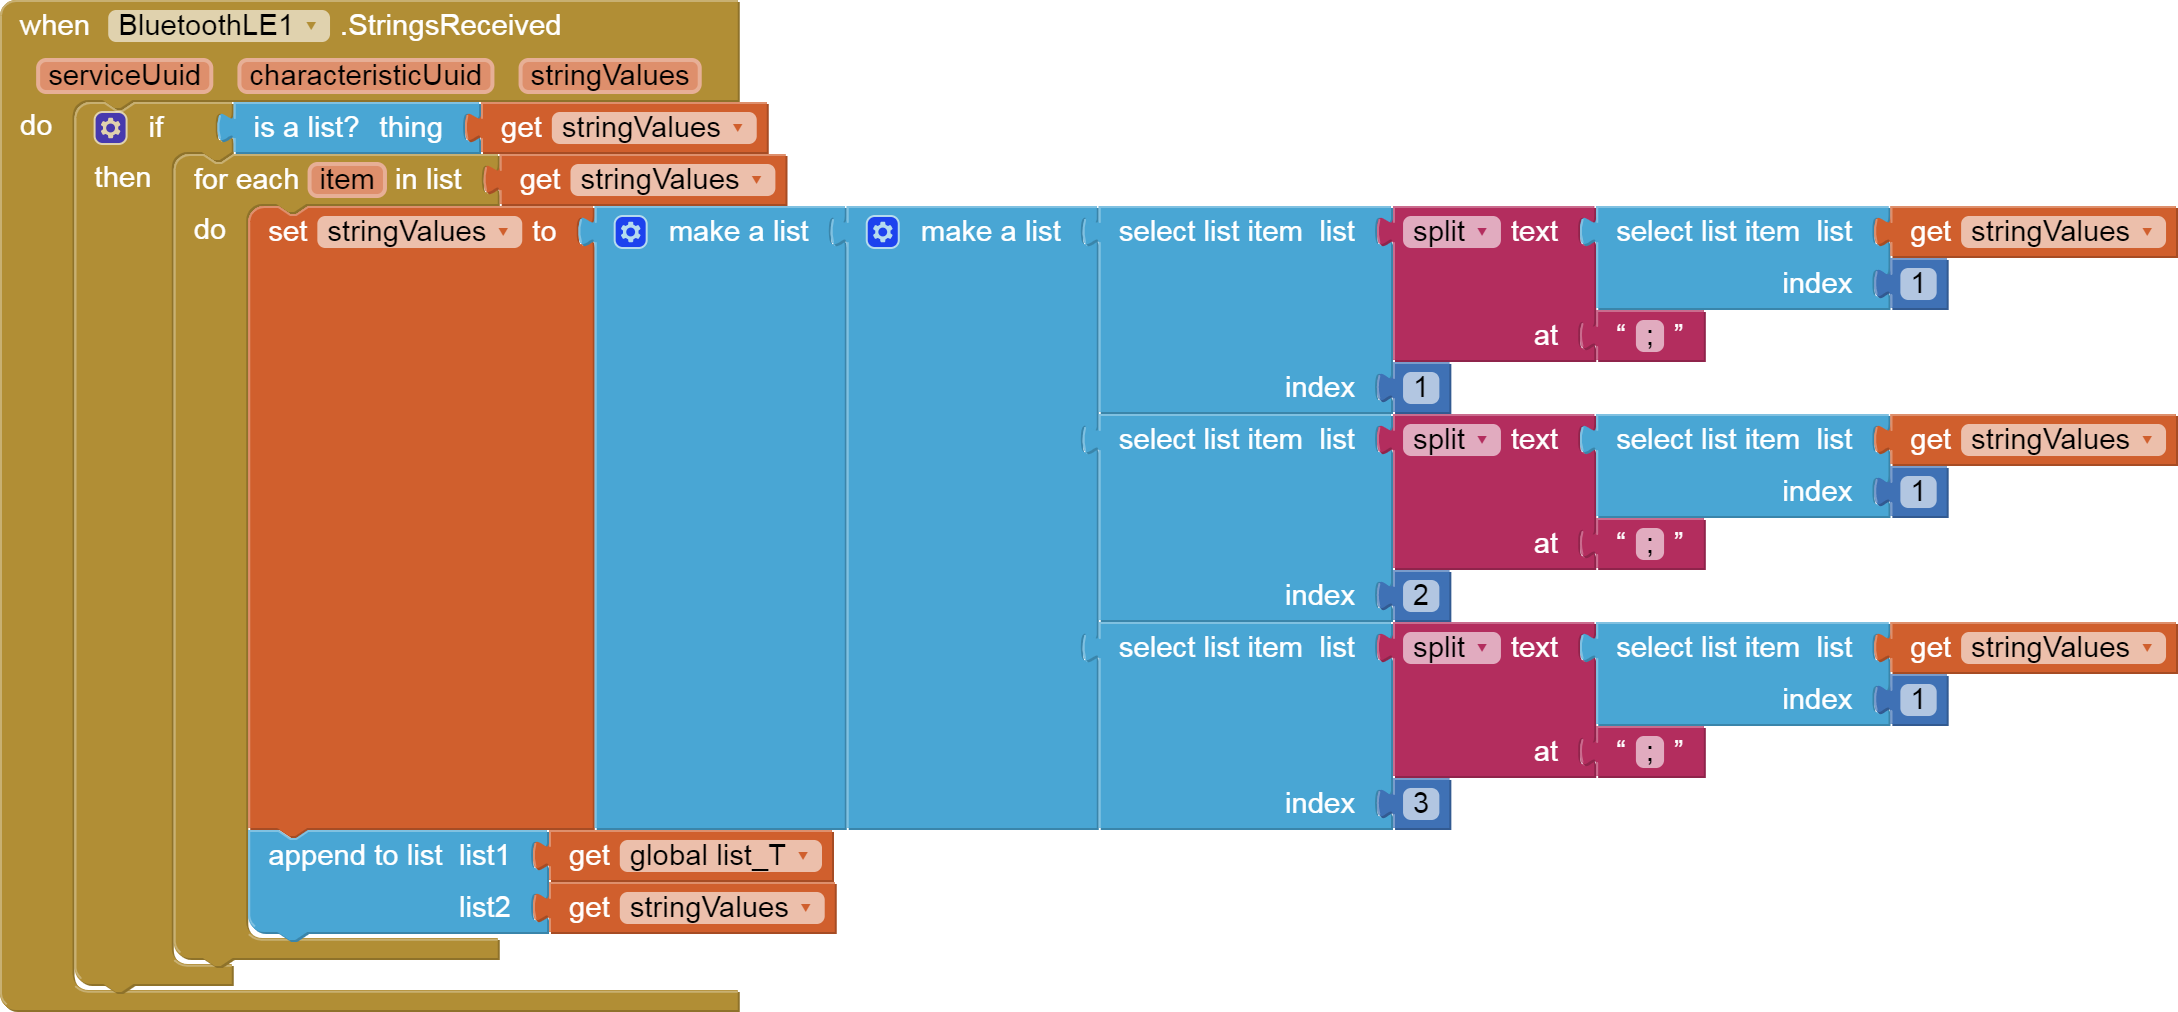
I just had a try,
it is not working because you endup with a list which look like this (according to ListView)
a1
b1
c1
a2
b2
c2
....
instead of looking like :
a1 b1 c1
a2 b2 c2
...
To be honest I do not understand really why I need to do twice the "make a list" but TIMAI2 (or you) may have an explanation 

many thx! 
Hi all,
An additional question on the chartmaker extension:
let's consider we have a list of list with severals columns (more than 2), and plenty rows, as we managed to get in the previous discussion:
is there a possibility to just choose to display only 1 column? (instead of having all of them displayed?). In other word may I choose to display in chartmaker a specific dataset only?
In the applied example below I display automatically both "temperature" and "humidity", but I don t want to display humidity anymore. How I can handle that in the "values" ?

Hi,
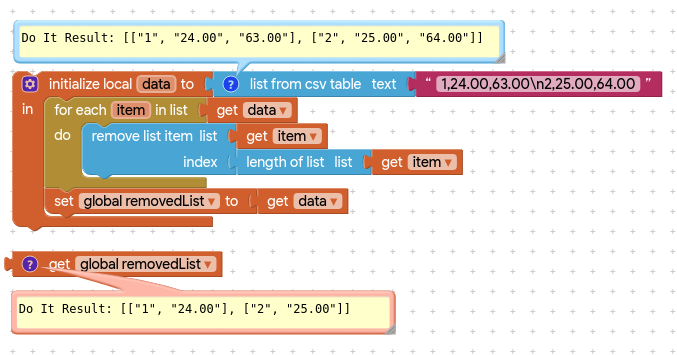
I m looking to remove a full entire column in on of my list so I can plot it using chartmaker extension (it s a work around since I m not sure we can select the data we want to display -> it s on discussion in another topic).
My current list is looking like this (when I see it on list view):
0,21,68
1,22,65
2,21,62
3,25,62
...
and I would like to get:
0,21
1,22
2,21
3,25
...
So first I did copy the list and try to remove the column 3 by implementing a loop with a while
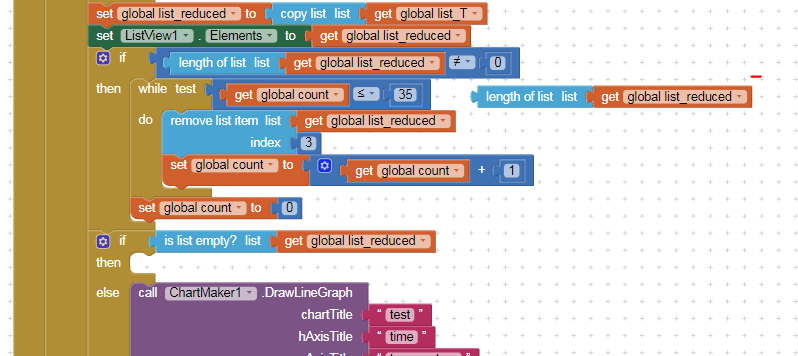
and I got this error: (the first row with -0.08 is normal )
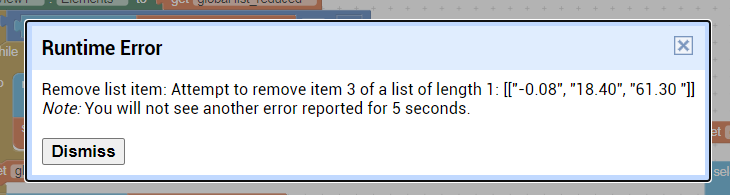
Any suggestion?
thx by advance
 !
!
I think it was not a good idea to merge the two threads, this one and [Remove column in a list of list]
Thx! it s working nicely 
hello, I have a similar problem here, but it might be more simple.
I tried to make a line chart from existed data in google sheets.
I use the chartmaker extension. But it didn't work. The line chart didn't appear.
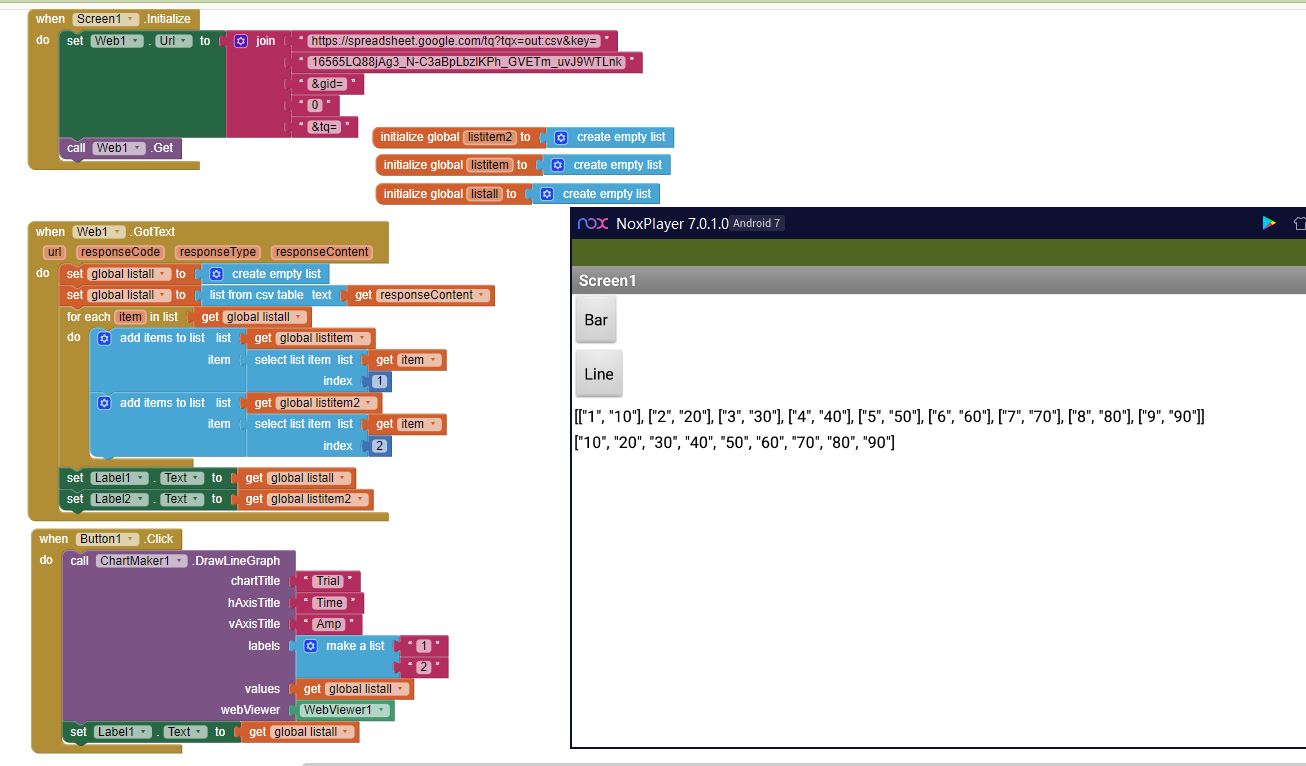
would you mind to help? thank you