Hello everyone,
I need some help with the Chart component.
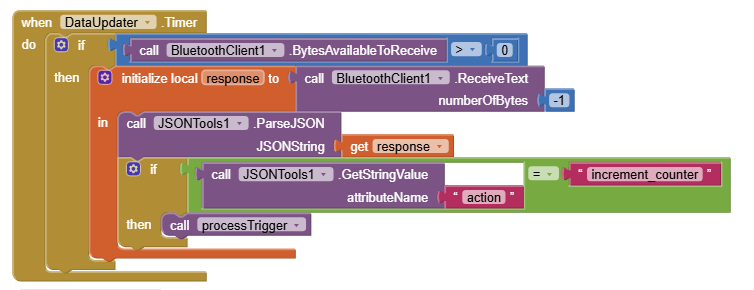
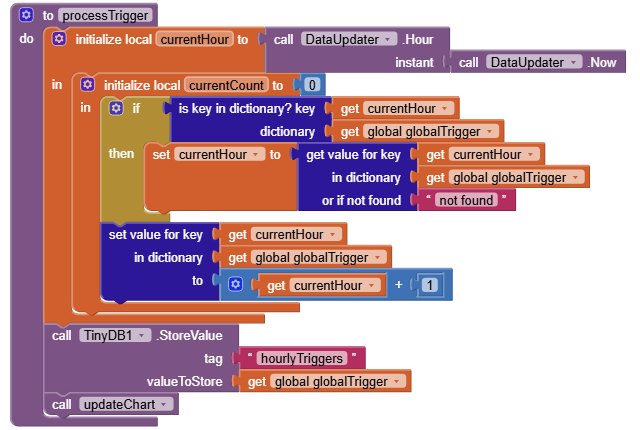
My Goal: I'm building an app to track events over time. I'm receiving JSON data from a PC over Bluetooth. I process this data and store the counts in a global dictionary called globalTrigger.
Here’s how the logic is supposed to work: The app uses the phone's current time to group the data by the hour.
- For example, if a JSON message arrives at 10:30 AM, the app should find the key "10am" in my dictionary and add 1 to its value.
- All messages received between 10:00 AM and 10:59 AM should increment the counter for "10am".
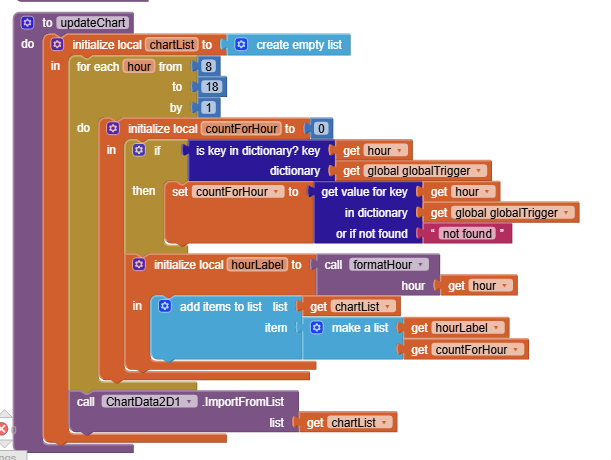
- When the clock rolls over to 11:00 AM, it should then start incrementing the counter for the "11am" key on new messages. Finally, I want to display this dictionary data on a chart, with the hours on the X-axis and the counts on the Y-axis.
The Problem: When my updateChart function runs, the chart doesn't display. Instead, I get a persistent error message that says: invalid entry : 9am, 0 invalid entry : 10am, 0 etc.
What I've Tried: I believe the issue is with how I'm formatting the data for the ChartData2D1 component. I've tried two main approaches to get the data into the chart. First, I tried creating a single list of pairs (like [['9am', 0], ['10am', 5]]) and feeding that to the chart. My current attempt involves creating two separate lists: one for the hour labels (X-axis) and another for the count values (Y-axis). Unfortunately, both methods have failed and result in the same "invalid entry" error.
Could someone please look at my blocks and tell me what I'm doing wrong? What is the correct way to get data from my dictionary into the chart?
Thank you!
The code :