How can you use the LocationSensor to plot on a map without using an Internet connection?
With an internet connect, most App Inventor developers use:
- The Map component and OpenStreetMap map tiles
- The Google Map API and Google Map tiles (Static Map, Java etc.)
- The ActivityStarter to elicit an intent to use Google Maps
- Other Map APIs.
All these methods normally require your device is connected to the Internet by WIFI or using data to access the online 'maps'.
Without an Internet connection,
- Google Map and OpenStreetMap provide map tiles over their servers . These tiles produce the maps you might use in your app as required. When you do not have a data or WIFI connection to the map servers, you do not ordinarily have access to the map tiles; your app does not have a map to plot locations. Your app caches OpenStreetMap tiles previously 'visited' while using the app if you use the Map component.
- your app has no access to the feature of LocationSensor that can provide a street address (CurrentAddress).
- Map tiles can be 'simulated' and you can plot on your own map images you provide.
How you might simulate a map tile:
Use a base map (or several base maps) loaded as images of the area(s) of interest to plot locations on. Place the 'map' images on a Canvas.Background. Plot location information on the Canvas. The Canvas has its own coordinate system but Canvas coordinates are not compatible with geocoordinates. Convert geocoordinates to Canvas x and y's and vice versa using an algorithm.
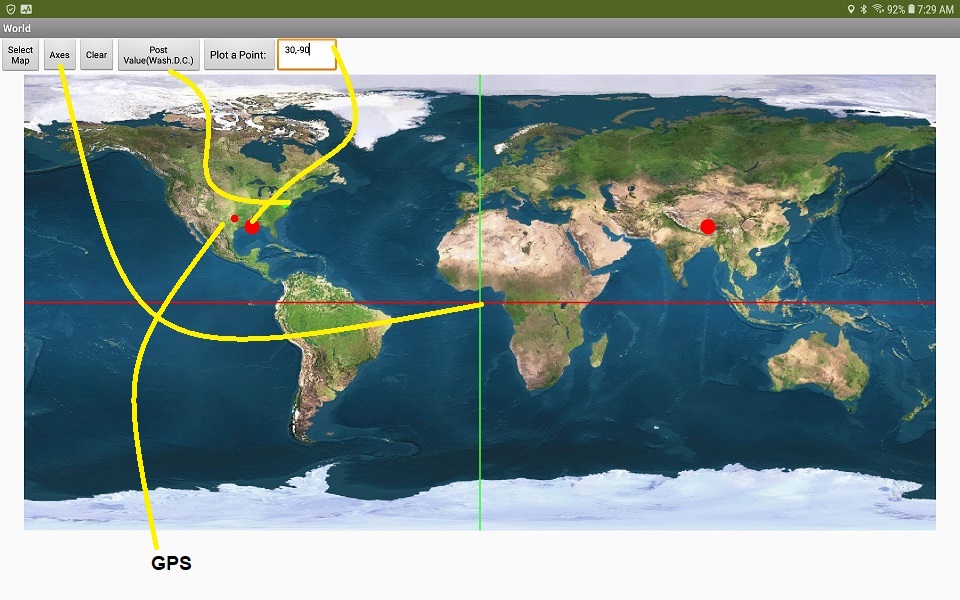
Provide your latitude and longitude coordinates to plot on the map using your GPS receiver on your device. The GPS hardware in your Android is a radio receiver that does not require the Internet to perform its magic. The GPS will find you. ![]() with a WIFI or data connection.
with a WIFI or data connection.
Plotting to the map. The image dimensions of the 'map' are in pixels, the location information is in latitude and longitude. Convert the WorldCoordinates of the location information to the Map Image coordinates. To perform the coordinate conversion, you
- need the geolocation coordinates of two opposite corners of the imagemap;
- write a routine to transform the WorldCoordinates to the imagemap coordinates.
Only then do you have sufficient information to plot a marker on the simulated map showing the location (a sprite will plot on the Canvas as a marker).
Are there other ways to plot to a Canvas? Probably. Check out this thread Redirecting to Google Groups .
Using an image on the Canvas as a map and using the map with the LocationSensor takes a lot of math, patience and coding experience. You must understand what a flat map is and how geolocation works. Arbitrary map projections you use for the image used as the map can cause you positional plotting issues. Locate a 'flat' map to project on to keep things simple. Otherwise 'correct for the map projection' in your routine that actually plots coordinate information . No correction needed on a flat map.
AI2 Flat Maps - unchain yourself from Google Maps
Plotting to a map on a device not having a WIFI or network connection can be accomplished if you have a non-Google flat map to display location as a Canvas background and plot the GPS location onto the flat map. If your device is connected to the Web the choice of using a flat map or a Google map is easy. Use the Google Map or Google Static Map or the Map component as your map; the established aps are more precise and less hassle. The techniques here are relatively imprecise and very useful for some purposes.
The Android device requires a connection to the Web to use the Google Maps or Map component. Follow the tutorial referenced here http://www.appinventor.org/Chapter6 and plot location information to a map. Control the zoom with coding that points to the url to the Google map or use Google’s Static Map API or Map control (to use OpenStreetMap map tiles).
You might copy the static map as an image to use as the Canvas background image. You can use Google’s or OpenStreetMap's Mercator Map projection in your app (if you can figure out the coordinates of the map corners). Properly provide attribution to Google. Finding the corners of a Google Mercator map or map tile is difficult whether you use AI2 or Windows etc. This tutorial does not go through what is necessary to change the map projection from Mercator to a Flat map. In most instances, depending on the map scale, the differences may be trivial.
A flat map is …..
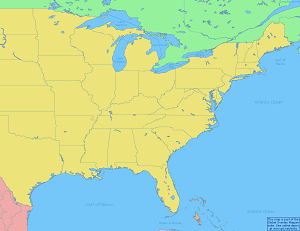
- An easy way to get a flat map to use in your non-Google (or OpenStreeMap) map app is to design a specific map at http://www.openstreetmap.org/ The organization requires you to register (free) but then you can make the free maps you can download to your computer.
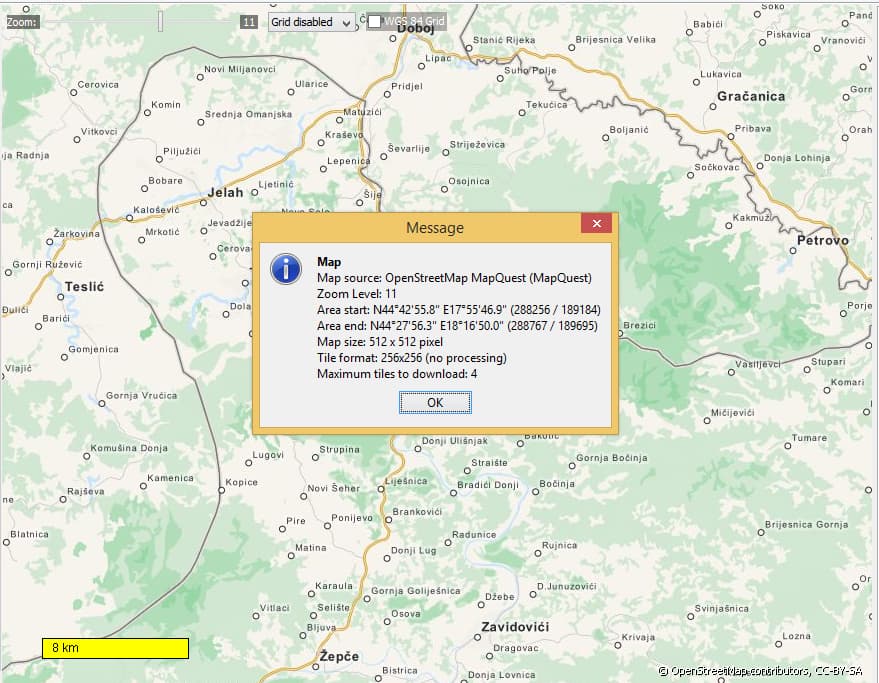
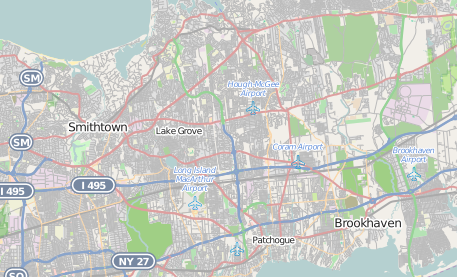
The map above was obtained from OpenStreetMap. Creating a map image with OpenStreetMap is a free service. This map is an example to demonstrate how everyone can free themselves from Google Map tyranny later in the tutorial. The map image is 512 pixels x 512 pixels. These dimensions are of a size that renders on a phone or a tablet, but at reduced scale.
-
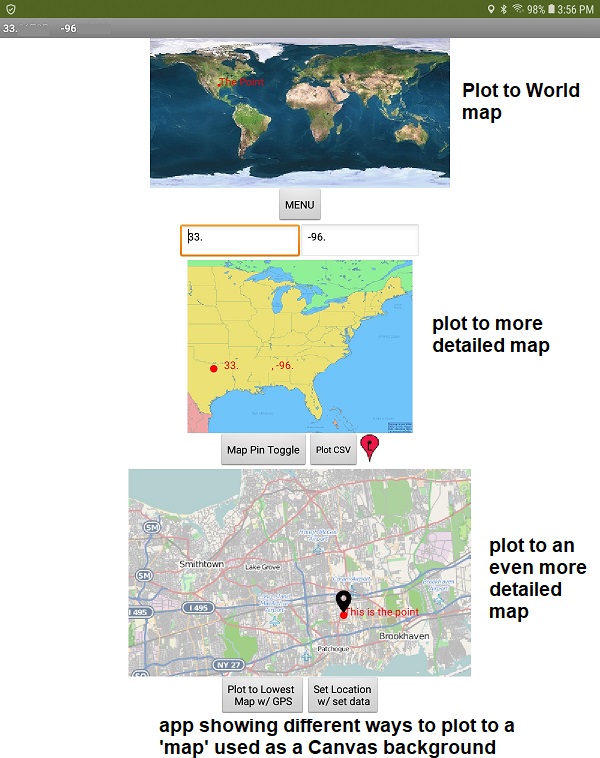
You can use the OpenStreetMap image, with your coordinates (the x and y positions of the locations of buildings, restaurants etc. on the Canvas.BackgroundImage) and work as you are doing. Make a OpenStreetMap at a higher detail level and you get a second zoomed image. Then, use the second map to "zoom" to the buildings you want showing more detail posted on a second Canvas.BackgroundImage Replicate the coding the coding you used so far. Place a sprite on that object or just make the more detailed map visible. (Hide the second Canvas when you do not want it).
-
You can use a different way to locate the sprites on your map:
The diagram attached is intended to help understand concepts. If you do not know and understand this stuff, you can not plot GPS 'pin's on a user provided map using conventional methods.
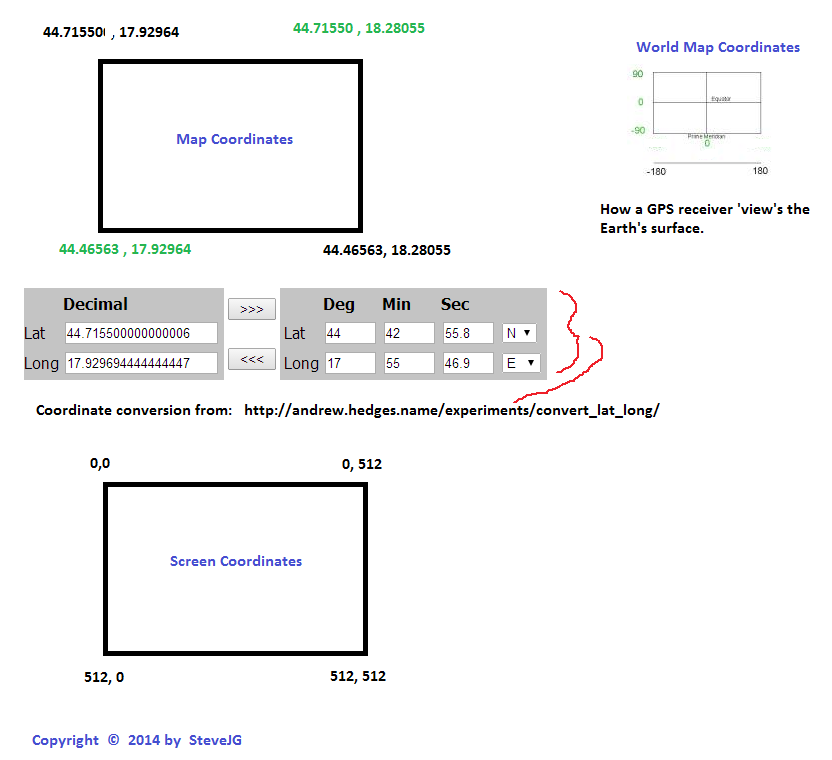
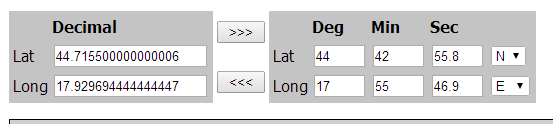
World Map Coordinates: How the GPS reports location information. Seafaring navigators use Degrees, Minutes, Seconds (DMS) to report latitude and longitude; GPS receivers (and computer programmers) use decimal degrees. If it were only that simple. Decimal degrees West of the Prime Meridian are reported as 0 to -180 degrees, East of the Prime Meridian are reported as 0 to + 180 degrees decimal.
When you use a custom map to display information on your device, you relate World Coordinates to Screen Coordinates. If your map is entirely East of the Prime Meridian or entirely West of the Prime Meridian, converting from Map Coordinates to Screen Coordinates is rather straight-forward (I did not say simple, it is complex). If you have a map that crosses the Prime Meridian, the math gets complex.
The Canvas screen is defined by the size of the Canvas in pixels illustrated on the Screen Coordinates diagram above. Assuming your map example is defined with the Canvas dimensions as 512 x 512 you get something like shown (the diagram is just to illustrate the concept) The black coordinates is what your map generation program provides, converted to decimal degrees, the coordinates in green is what I interpolate as the coordinates for the remaining map corners..
To plot a location on the map image (let’s post it in the very center of the image in this example ( 44.59056 , 18.10509) ). Plot a point on the Canvas 'screen' at 256, 256.
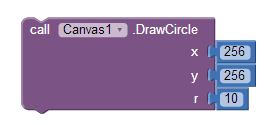
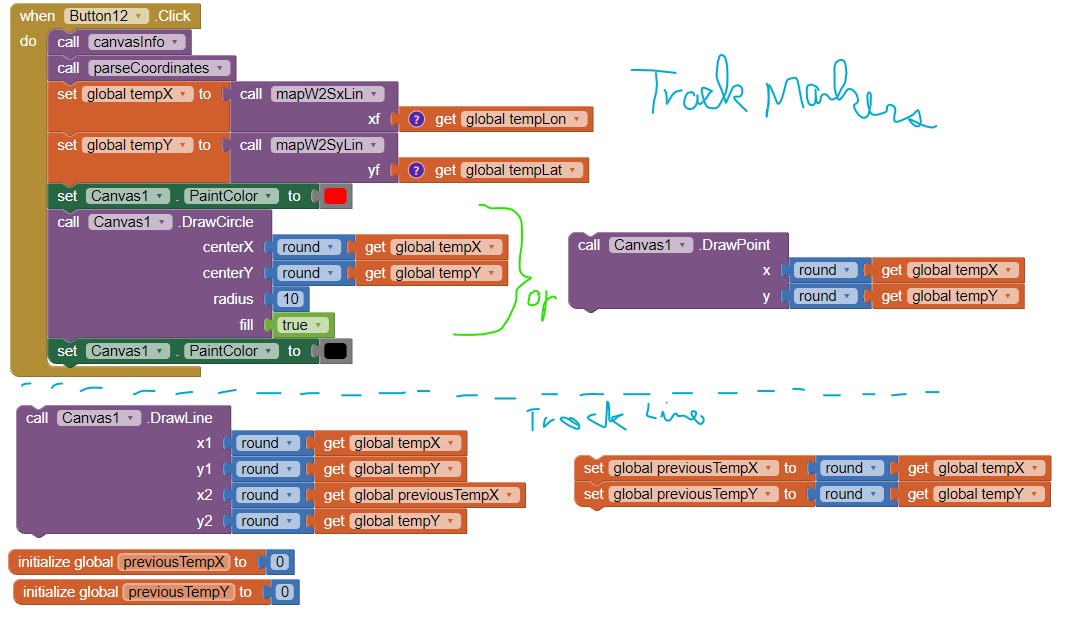
To plot a point using the information from the LocationSensor, you write a procedure to translate the location coordinates to Screen coordinates. The example of below shows one way to use a Blocks Procedure.
If you always use the same User Map with the same dimensions, your problem is solved.
If you want to do zooming in and out, you got a lot of work to do.
I converted the DMS from an OpenStreetMap map to decimal degrees. I did not keep all the decimal places since:
- a GPS only reports five decimal places and
- when you convert the World map coordinates to Screen coordinates, almost all of this precision is lost in rounding at the map scale we use in this example.
When you plot a pin or icon at any GPS coordinate it posts to an approximate location on the Canvas map. Can this get any more difficult? Yes, certainly. For instance, the map you use is composed of pixels, a pixel's height is larger than its width, so this size relationship introduces distortion in the posted map image. Do you NEED to correct for the imprecision? Possibly not. You can compensate mathematically by adjusting the World to Screen and Screen to World conversion algorithm. YOU have to write these procedures that would increase precision.
Posted is an image of the algorithm I use to convert the map Longitude to a screen coordinate (mapW2SxLin). Use a similar algorithm for the Latitude. Reverse the transformation to get from Screen Coordinates to World Coordinates to extract information from the map later.
The four functions I used to convert latitude and longitude information are AI2 block procedures.
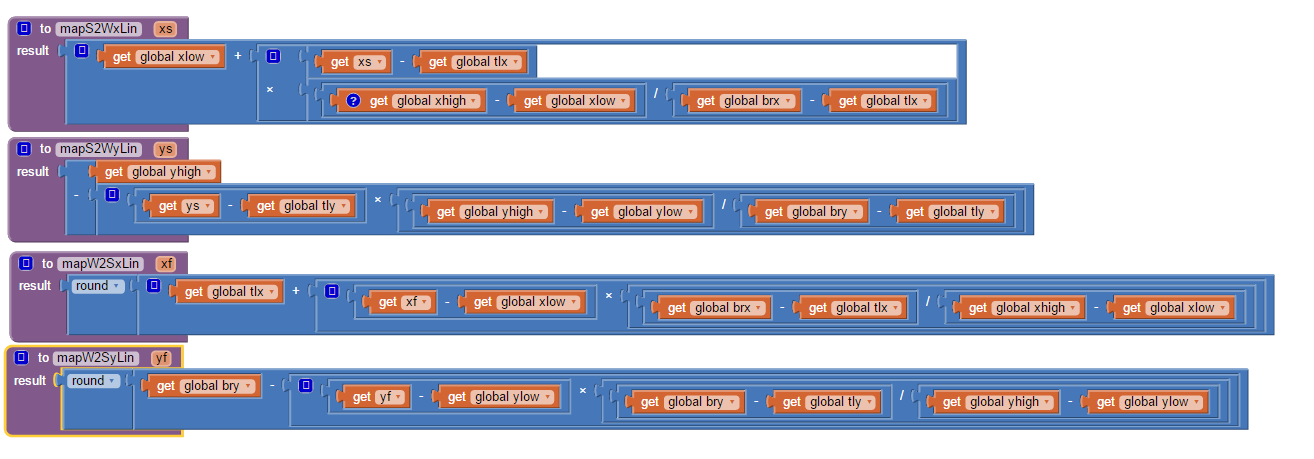
The algorithms to convert World Coordinates to the Screen coordinates of the Canvas control are derived from Pascal code here: delphi mapping screen and world . The algorithms are summarized:
Mapping world and screen coordinate systems to each other is done by scaling with respect to an offset.
be the world window be defined as:
[xLow..xHigh,yLow..yHigh], the coordinates are of type float
be the screen window be defined as:
[tlx..brx,tly..bry], the coordinates are of type integer
the following function do the conversion :
function mapW2SxLin(xf:float):integer;
begin
result:=round(tlx+(xf-xlow)(brx-tlx)/(xhigh-xlow));*
end;
function mapW2SyLin(yf:float):integer;
begin
result:=round(bry-(yf-ylow)(bry-tly)/(yhigh-ylow));*
end;
function mapS2WxLin(xs:integer):float;
begin
result:=xlow+(xs-tlx)(xhigh-xlow)/(brx-tlx);*
end;
function mapS2WyLin(ys:integer):float;
begin
result:=yhigh-(ys-tly)(yhigh-ylow)/(bry-tly);*
end;
The above Pascal algorithms are from: delphi mapping screen and world . They are written in a version of Pascal.
A last note, be aware that the AI2 LocationSensor uses periods as a decimal separator. Most Europeans and others outside North America use a comma (,) so you may have to convert the LocationSensor information string to replace the (.) period with a comma (.) to get the App User's location to plot on your map.
An app that demonstrates the principles discussed and allows you to experiment: See Example 1 below.
How Example 1 works
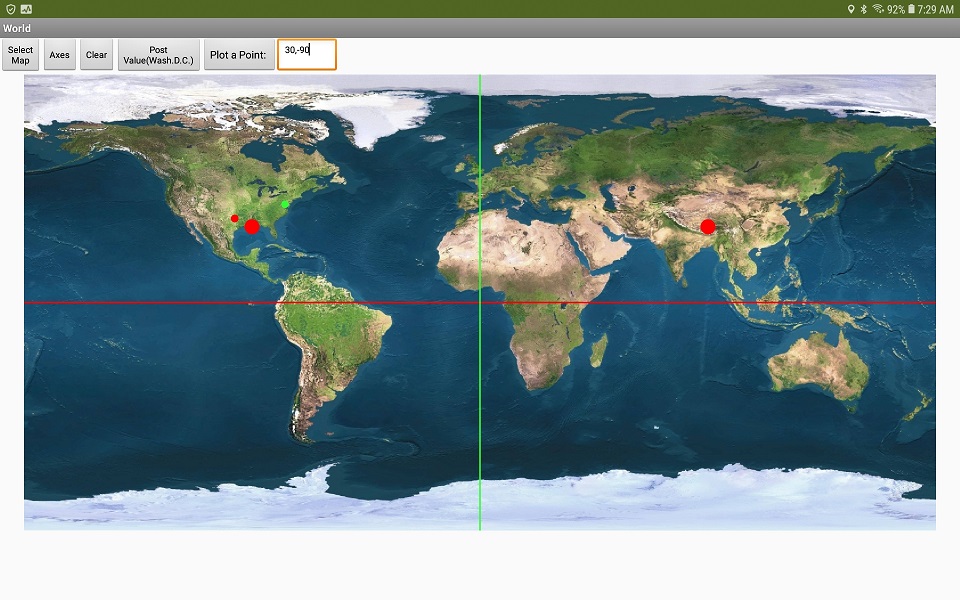
Touch any Canvas Map to display the 'gps' coordinates of that point in the Title bar.
This app is a demonstration of techniques that can be used with App Inventor to plot geocoordinate information to any Flat Map used as a Canvas background. It uses a Canvas and a LocationSensor. If the developer is willing to write some additional code to correct for the variation in separation of degrees of latitude that varies on a Mercator map, that map projection can be used too. In fact, if the Mercator map you use displays only a few miles North and South and East and West, the plotting error invoked by using a Mercator map as a flat map is minimal and probably can be ignored (unless the developer requires precision).
The Example 1 app has three flat maps, of very different origins and scales. The three maps demonstrate the usefulness and limitations of using a flat map within an App Inventor 2 app.
This NASA image (NASALivingEarth.jpg) of the World is displayed as a flat map. The left edge of the image has coordinates of -180 deg. West longitude, the right edge of the image has coordinates of +180 deg. East longitude.

This map is by an amateur radio operator and was originally usa_east.gif, converted to usa_east.png for use in App Inventor. Coordinates of the corners are provided in a separate file.
This image is from OpenStreetMap showing an area of Manhattan, NY.
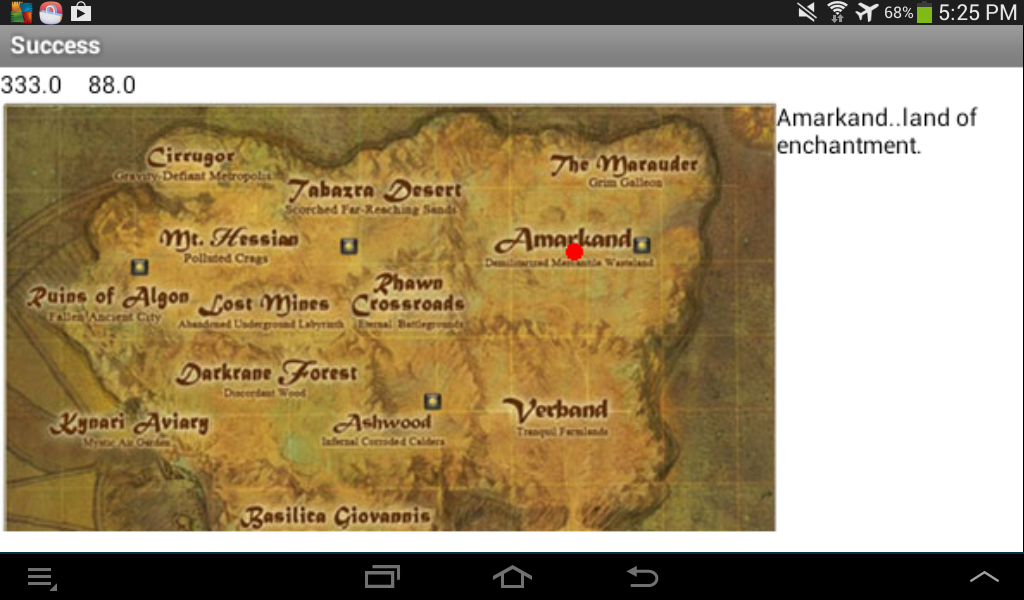
A fourth type of ‘map’ consisting of the outline of a building or a fantasy map can also be used as a screen to plot to. It is easy to set up. Instead of using gps coordinates, use the Canvas screen coordinates to locate objects .
Example 2 described below uses similar flat maps.
Practical Examples
Two complex example apps use flat maps you can experiment with:
Example 1.
FlatMap_II.aia (1.8 MB)
Use the MENU with the NASA World map to select the GPS to plot and to manipulate the screen.
Example 2
PlotToAnyMap3.aia (339.8 KB)
Experiment to see how each example works. The documentation is the Blocks and this tutorial. It is minimal.
What you can plot on each of the examples using your GPS depends on whether the coverage of the map extents can plot your geocoordinates. Your geocoordinates need to be within the map bounds.
Make your own map using the guidelines to plot your coordinates.
This tutorial is posted (in its original form) in the old App Inventor Google Forum. Unfortunately most of its images do not display properly in that Forum. The version of the tutorial is similar.
I hope these examples that plot geocoordinates to a Canvas background image are useful for someone. The examples were developed on an Android 8.1 Tablet. They were tested on an Android 11 cell phone and the tablet.
Obviously there are other techniques that can be used to plot coordinates on a flat map. If you have an idea, please post it.
Will this work with App Inventor for iso? Sorry, I do not know.
Regards,
Steve