But, I don't like the way it keeps resetting the screen after 10 points of data (yes, I know that is the clear chart commands job).
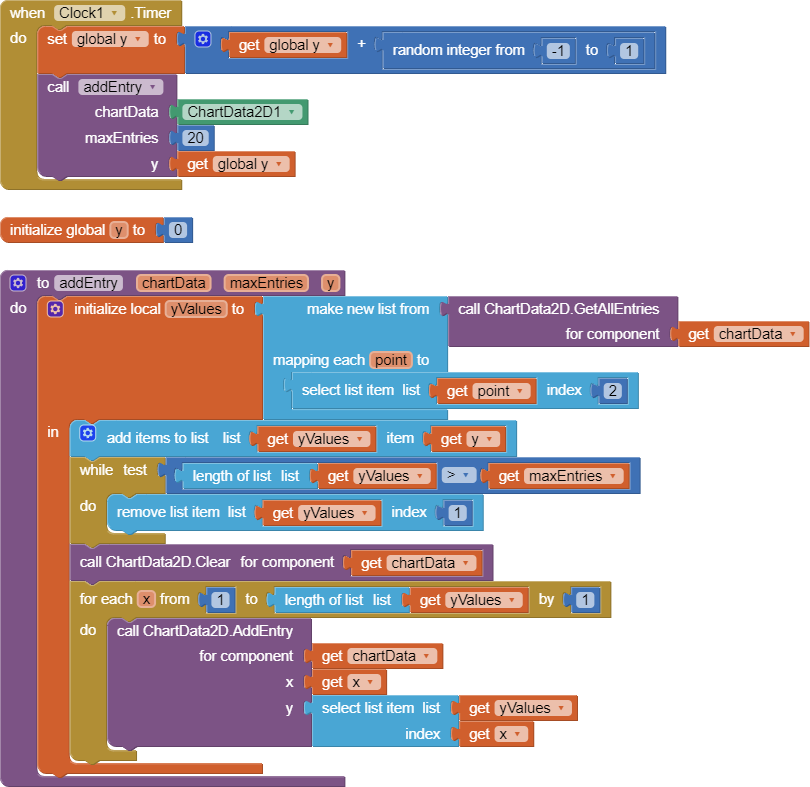
Ideally, I would like to keep the scrolling data to a constant last 10 points of data on the screen.
For this, I would assume I need to somehow firstly fill up a list? with the first 10 X values, and then after 10 values have arrived, continually shift these values down the list and display them? (deleting the previous plotted point first for each X position).
Is a list the correct item to use?
Any guidance would be great. Been searching, Googling and experimenting for a couple of evenings now and not cracked it.
I have the graph scrolling. Needed to turn off the 'XFromZero' and 'YFromZero' boxes in the designer as well.
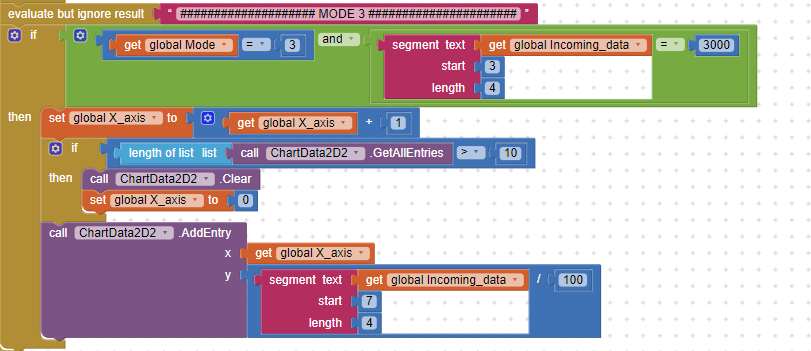
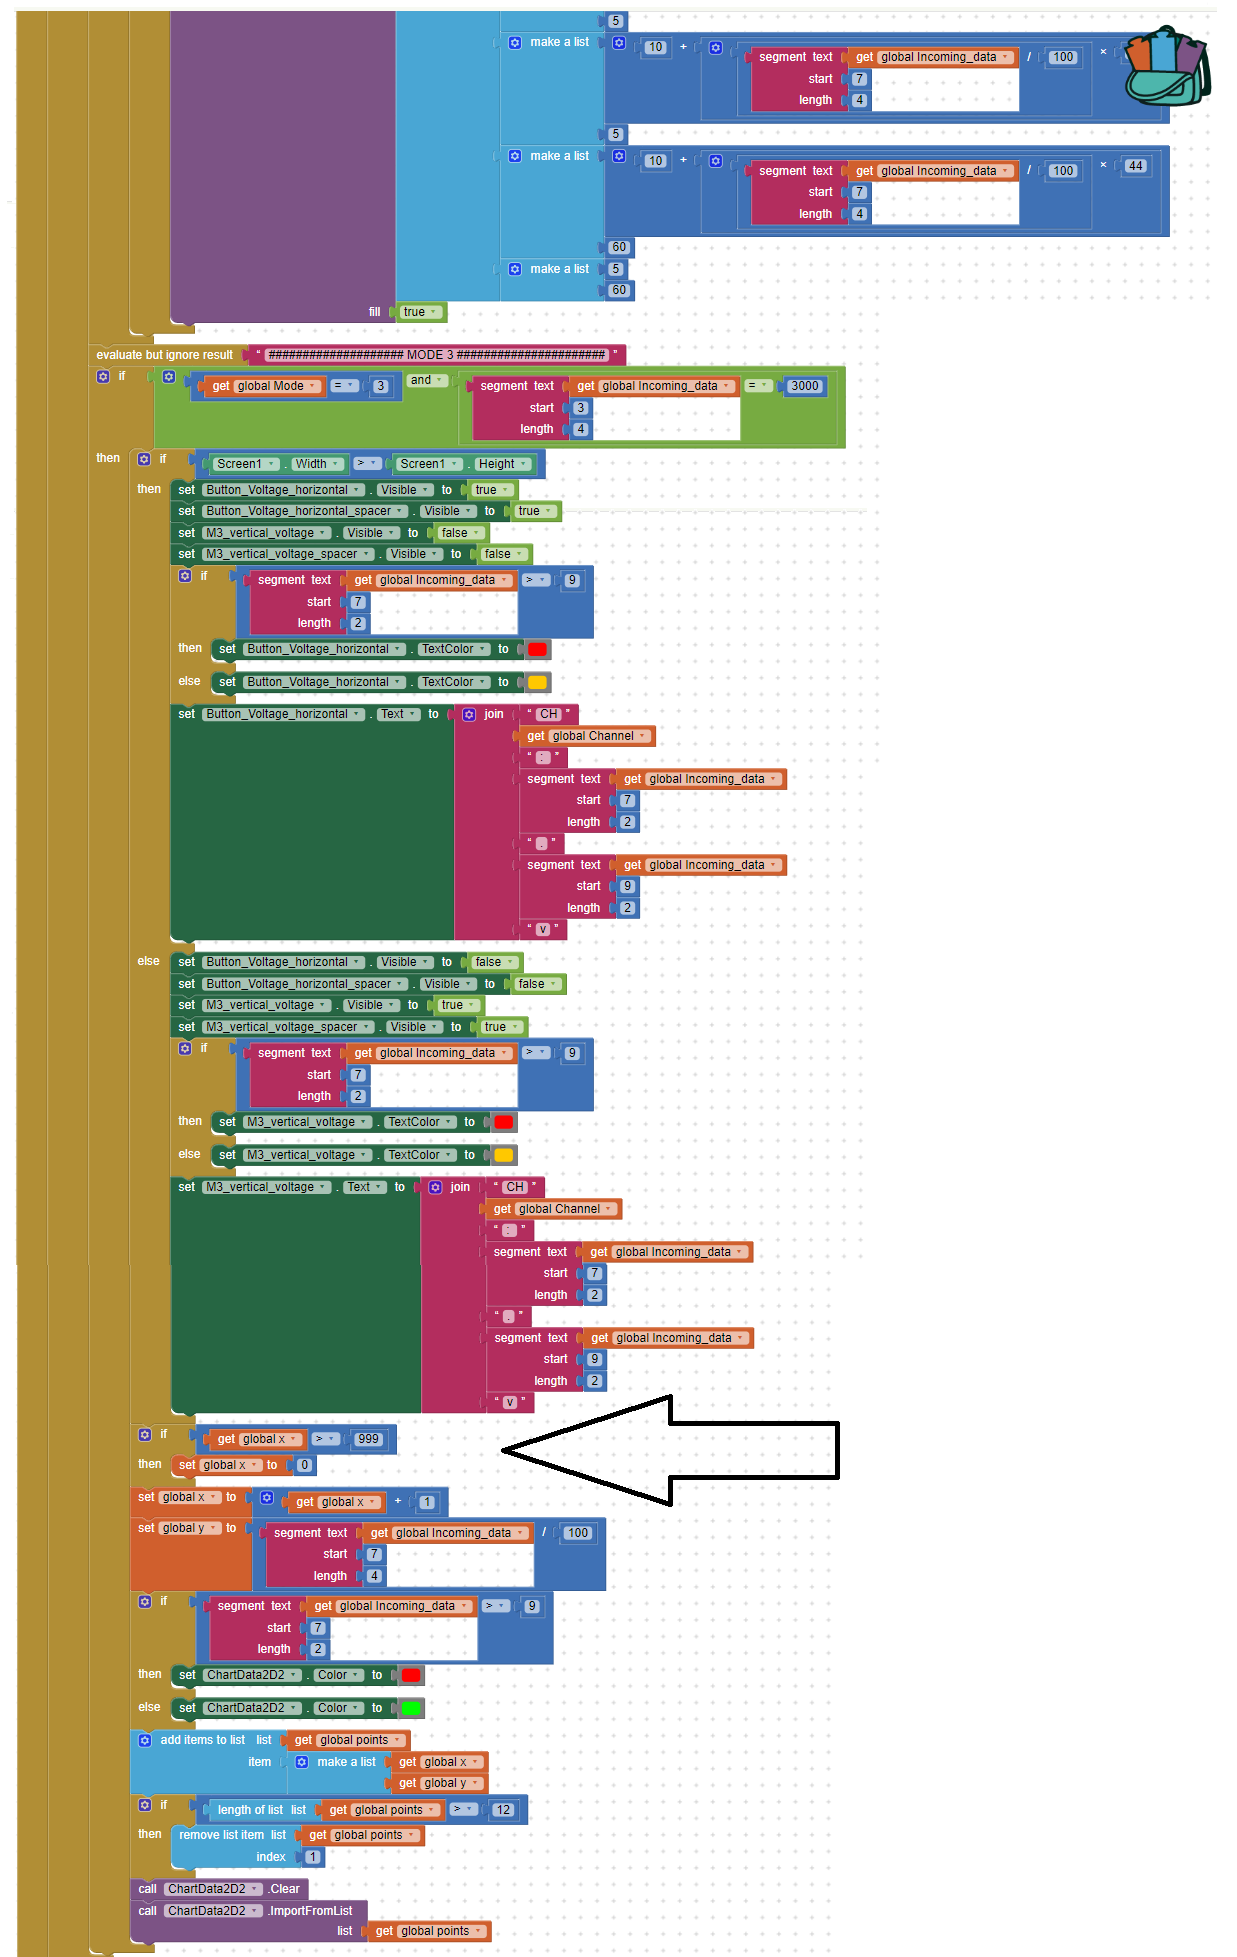
The pic show the blocks. If I enable the 'global y = 10' (black arrow), then the graph works with y temporary set at 10. Fine for testing.
Above that (red arrow) is the actual incoming data. It arrives in a string over BLE and if the string includes '3000' starting at position 3, then it's information for the graph.
That part works fine.
The actual data to show on the graph is within the string starting at position 7.
How do I convert the 'global Incoming _data' text that is extracted using the text extraction block and convert that to a usable variable?
Only thing is I don't want the X value to just run off into the distance and get bigger and bigger.
Arrow shows my reset line, but this messes up the graph and I get some weird line with points on it until the first 12 points are plotted, then it starts correctly.
How do I reset the graph? I also added chart.clear, but that didn't work (for some reason)