I think that only adding the name and it appearing on the label test will be enough
What about this Chris?


I have to create new variables?
leave it to me 
Thanks Chris
Hi Carles
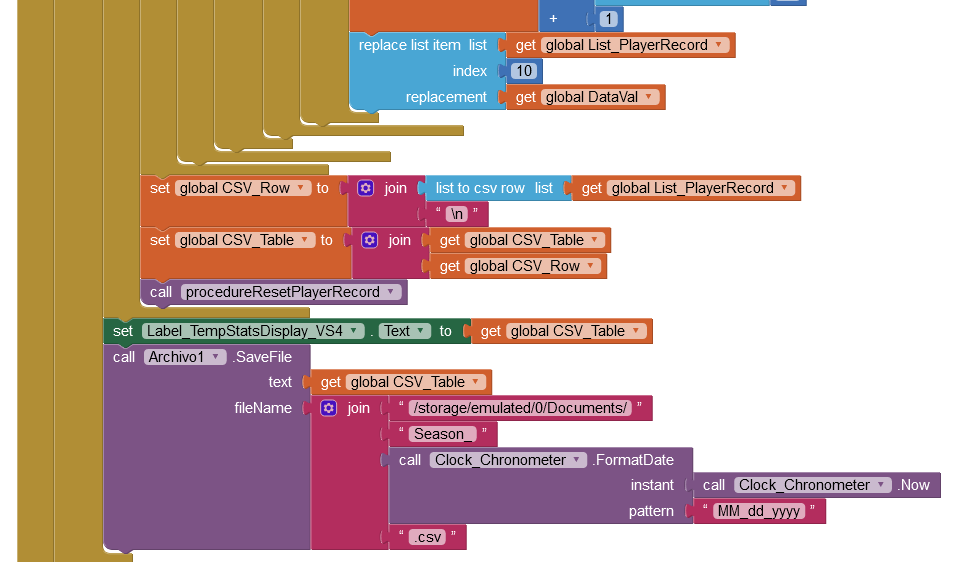
Well, still a lot to do, as mentioned before. The attached 'RB_Virtual3.aia'
- Collates Season-so-far Player Match Data
- Saves the data as a CSV Table file in the Android shared directory 'Documents'
- Displays the data in-App
To fully test, you must build an APK. I have tested CSV files in the Google Sheets App and in a Spreadsheet App, both on my phone. More can be done in the App, for example a Table sort. You'll need something similar again for the time statistics, that needs some thinking about first!
RB_Virtual3.aia (151.8 KB)
Hi Chris,
The only thing that lack in the table it's the time to do the real analysis of data.
Still many thanks.
Indeed, but firstly the recording of the times needs to be right - then we need an insight as to how the recorded times are to be presented in stats for meaningful analysis.
I think if I upload the table and the data without being at the table because I have time I could do everything
Something got lost in translation there ![]()
What would your data analysis look like in a spreadsheet? Perhaps you can make a spread sheet with fake values for us to understand?
The data that just makes the 'Season so far' table is huge. But that Table would not be used to display time statistics - if for example you wanted an analysis of how frequently each player scored a basket, you would add the periods of time together (seconds) and divide that by the number of baskets scored. That data can be tabulated or saved as a CSV. I think it would be very difficult to do the same calculation in a spreadsheet with the raw data.
The idea is to make, for example, a table showing a top 3 of those who score the most in the last few minutes, for example.
It can be done in excel but as you say it is quite difficult although I think I know (with the help of my father), but if it can be done in app inventor and it is easier and you know how to do it then we can look at it.
If you just do a drawing of the tables you need, and give a description of what they present, then that can all be done in-App
Given that this type of information has to be calculated in stages, it is very difficult to achieve in a spreadsheet - especially when the data is changed every time another match is played.
Neither an App nor a spreadsheet can understand "last few minutes" so you would have to quantify that, e.g. "last five minutes".
...even that needs to be dealt with (which I think you have with the Inicia and Para buttons) because a 48 minute mens game is much longer due to all the stoppages (fouls, time-outs, half time etc).
Let's see, my idea is to make tables with possible variables that go between x and y of time. For example, here in Spain the games are 40 minutes long, so from 0 to 3 minutes, whoever scores more points, from 37 to 40 the same. And so, when putting the formula in the box, once the data is updated, it is put directly
...and that's the difficulty, because the raw data is a record of when each basket is scored - that's the first stage. The second stage is to calculate how many of those where within the time limits (0 to 3 minutes and 37 to 40 minutes). The third stage is to sort the data to show the top 3 players in those categories. You should of course discuss this with your Dad.
The other things to consider are - who is going to view the information, and how will they access it, and on what platform (Windows/Linux/macOS on a Desktop Computer or Android/Apple iOS on a phone/Tablet). If a lot of people will view the information, it would be easiest to display it on a website, which can be viewed with any device.
One thing that does require code fixing is the time recorder!
I will show the tables on the institute's computer, which is windows, since that is where I make the presentation.
Once we correct the time I think it will be, what happens is that if in excel it is possible that it is not possible, I in app inventor do not know
Here is RB_Virtual4 - similar to RB_Virtual3 but the Table is sorted:
RB_Virtual4.aia (154.7 KB)
Concerning the presentation on the Institute's Windows PC, I would define the Tables as HTML web pages and display them in the Browser. Just as the App can export CSV files, it can export HTML files.
The App is currently exporting files to the phone's Documents folder. How are you transferring them to your PC? Via a USB Cable?
I can write the code for one statistic set, say the top 3 players on baskets scored in first 10 minutes, and you can use that as a guide to making the other statistics sets.
I am uploading them to the drive and from there I download them to excel (microsoft) because there are more options
I'd be really grateful