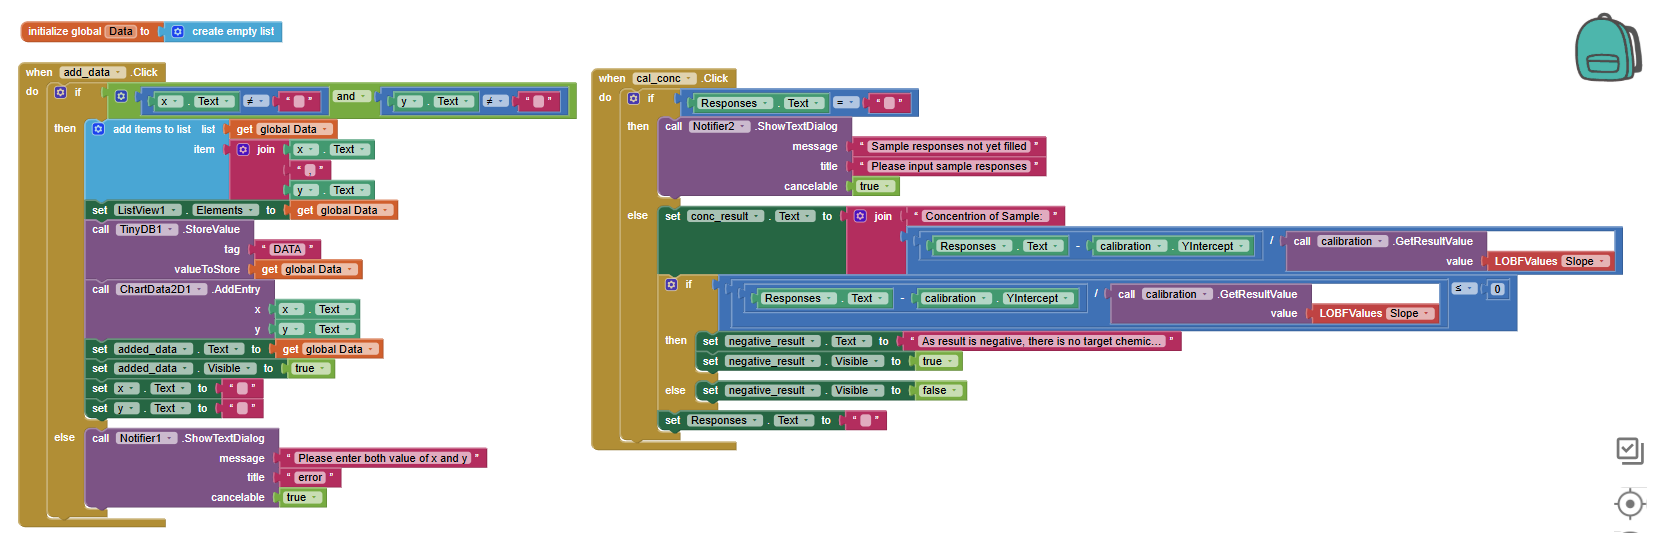
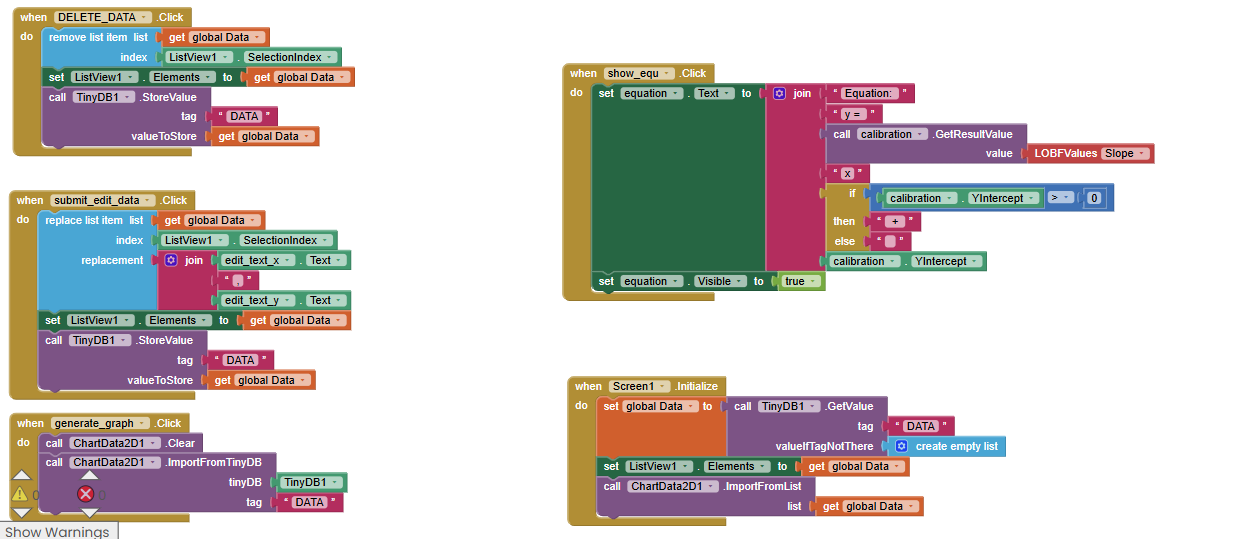
Hello everyone, I am a beginner of using app inventor and I would like to make a calibration cruve app.My problem is I do not really know after I add the data to list, how can I using data in the list to generate the graph.
Should I create a 2 list for x and y value seperatlly and use a list to hold this x and y list.
I would be really thankful if anyone can help me with this.Thank you very much