Searching extension or routines for drawing Stereoplots or draw into an hemisphere

Hello people of the community.
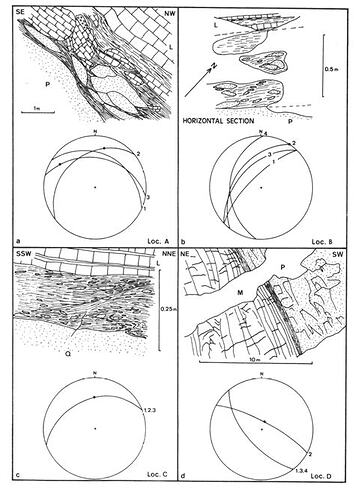
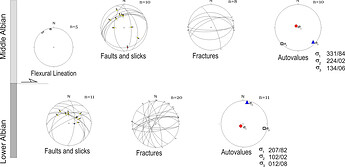
I am looking for info about to (how to draw stereoplots or stereonets with app inventor). This are 3D visualizations of lines or plots into hemispheres.
I was searching and i found nothing.
What is the purpose?
I want to make a free app for drawing structural geological points into this hemi spheres. It's usable for explaining how a plane, line or a dot, is in the 3D space but into a 2D diagram.
I don't know how to describe for not earth related scientist... but the diagram -visually "emule" with a diagram of a circle, with some lines and dots, what happens in a 3D environment. (into an half of sphere)
It's usable Fundamentally for Geology. (Soil, Structural Physic and Geological Mapping).

Here are some examples of this diagrams.


th-4135254930
th-1379011690

Again, i didn't find any clue of how to draw them with APP Inventor.

I will appreciate any constructive comment.
PD. By the way, i did found how to make it with python, but i want to make it with app inventor.

P.S. @Taifun Proper URL for Skulpt is https://skulpt.org/

2 Likes

Thank you very much for your comment.
This will help me in ANY way, because with this i can execute the py into the app inventor. Now only depends of the proper working in Python!!!.
I didn't know i can work with py with app inventor.
Again, Thank you!.

Here are some resources:

This is how to do what you want with paper and pencil and stereo net plotting paper

This one is old and not App Inventor but might be adapted to your purposes
https://www.usna.edu/Users/oceano/pguth/md_help/microdemtutorials/geol_ocean/stereo_net_lab.htm

App Inventor is not really suited to these types of activities. Graphics are mediocre and the math using Blocks is messy and overly awkward. What you need are tools to work with stereo nets. I am not aware of anything usable with App Inventor.

A potential resource is Stereonet 11 | Rick Allmendinger's Stuff . You should look at it; the software is free for academics and researchers. Not app inventor but it probably will do what you want to do with structural geology.

More sources for software Haakon Fossen Structural Geology links

Well Steve. Thank you for your links and your help.
This will be a long description. (sorry, but i must explain it).

The main problem is this.
If you go to the field, without internet (in the middle of the mountains, a desert or in a delta, a littoral area) you will not have a computer or internet.
So, The windows, mac, linux versions of the apps, are a blocked option. I find many ways to do it, but not WITH THE PHONES or Tablets.

PLUS. I want to use the compass, take the data, store and then plot.
Maybe one by one, the pair of data i mean. Maybe not dozens of points (that means almost 12 points by *3 or *4 info per point).
Not. I only want to make a representation FOR AND IN THE FIELD.
Why?
One thing is measure in the field, and another the projection in the Desk or the Lab. And... I have a problem with the SUM of Error. From the statistical point of view, when you go FROM THE FIELD TO THE DESK, You carry a lot of error.
A REAL Example. I am from Argentina, i need to go to Brazil, take some samples and take some measurements. BUT, when i return, i recognize many of this measurements ARE WRONG. Maybe someone take it, and you are in a group, and they dictate the numbers. Maybe the compass was broken, maybe the number 3 of one man is an 8 and was by writen, maybe was distracted and the 87º in one side was not to the left, was to the right....
if I returned, i cannot go back, and take the samples AGAIN (all the data taken is corrupt, is bad). You cannot trust it. (maybe if you look to other side :/, but is not the point. If you find a big error, is sure there will be MORE.

Well. This things NOW... ARE A MESS, because no one control the ERROR of the System, and from the technic... BUT IF YOU MAKE A COMPASS APP, TAKE THE DATA, STORE AND SHARE THE POINTS... Well. The amount of ERROR reduce almost TO 0!!!!!!!!!! CERO!... well, not 0 because many of the devices could have a miss match. But, is almost in that region of total success.
You only MUST TO PAY ATTENTION TO THE MEASUREMENT WITH THE PHONE OR TABLET. Because all the other things ARE AUTOMATIC!. And you are NOT CARRYING ERROR to the analysis.
That's the reason of TRY TO MAKE AN APP LIKE THIS.
Some geologist still have analogical compass, paper notebook, pencil or pen. (if you miss them?)... If you miss the pencil or the pen, you must return?!!!! or if the compass get broken too.
If you go to the field with 10 students and the app is in all the phones ... Well. There will be 10 measurements very near one of each other. Not really different measurements. They could have some deviation, but NOT BIG ERRORS.
I have my app, of compass, store the data, share data as screenshot (as a graph) and as a csv of the list of the measurements. BUT, i want to add the STEREOPLOTTING section.
For this problem... Seems i must learn Python, manage mplStereonet package and learn Kivy or other Gui tool or library, and port to Android.
BUT was almost done... And i need TO ADD a section to my app, in this case, i must to RE-MAKE ALL for this problem.

Well, That's my problem, and i think the problem of many geologist. Go to the field, trust in the tool, and as an academic tool, be good to represent the reality (not a cartoon).
I FEEL (and it's my opinion), WE, the geologist and other earth related science, produce some cartoons, because the tools ARE OBSOLETE. Even when we the Geologist have tons of new technology from LIDAR to sat images for (GIS), IN THE FIELD IS ANOTHER THING. In some fields, we use Obsolete tools. They work fine, but they carry a lot of problems and errors.

Steve. Thank you for reading my academic problem, and for helping me. (i can share with time a project related to recognize kind of soil with an IA), because we can recognize with a book (yes, a book with holes for recognize soils!!!! in this days!!!!.
But, for this, the principal problem i try to solve is the problem in the eyes of the Daltonics, they can't recognize the difference of colors.
And is very well documented, the woman, can characterize more colors than man. So. FOR RECOGNIZING, i make a tool.
The tool take a capture with the camera, and shows the colors similar to the a scheme. YOU as Geologist, MUST TO GET THE CHOICE. Because is not for an IA, the IA cannot learn of geology, and extrapolate choices in the field. And say, is this soil or ANOTHER... Even the daltonics geologist have a problem with the eye, they KNOW what kind of soil, is suitable for each zone they GO.

Again. Thank you for your help, i will continue searching how to improve my app for stereo plotting.
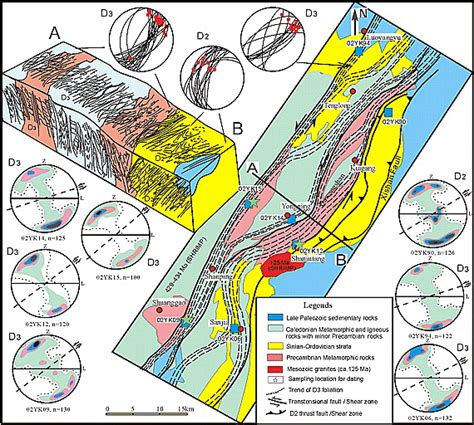
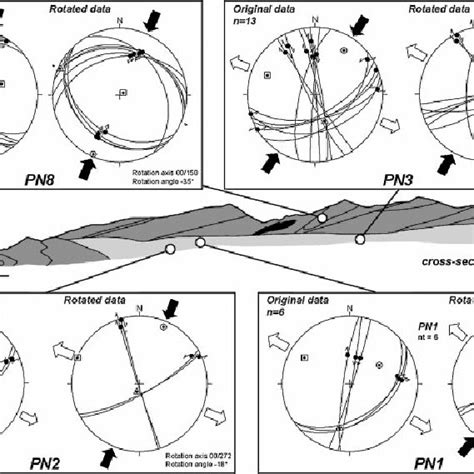
Buen Dia. @German_Skena

In 1992 I spent a week with some geologists and petroleum engineers in Las Herras to work a joint problem. Our Spanish speaker got sick, real sick. None of the Argentinian technologists spoke English. We spent the week drawing formula and diagrams on a blackboard; I understand the problems being in the field. No cell phones or translation programs then. I knew enough Spanish to read a restaurant menu and order a beer (dos cerveza certainly).

As amazing as the mapping tools available on a cell phone; you still need a WIFI or data connection to display a map using GPS coordinates. Access to the map requires the Internet. Sometimes you are in a remote location and cannot get a data link. You can always get GPS data and record it for later playback to a map. The GPS receiver in the cell does not use the Internet and can write the coordinates to TinyDB, a database that is within the Android device for analysis later.

You mentioned several issues you would like to address using cell phones and tablets. I'll comment on some of them. Some problems are solvable using App Inventor.

  • Soil Analysis - have you seen this solution to a triangle diagram? What is the appropriate function? - Soil Texture Triangle? - #21 by ABG . You might find it useful. As a graduate student, I spent part of a summer collecting soil samples; surveying the sample loations, then taking the samples back to school to sieve and classify. Yuk.

  • "you will not have a computer or internet".-- gps works and so does the internal Android database; use them to take your field notes. :slight_smile:

  • "I want to use the compass, take the data, store and then plot." You can. The plotting you can do when you get home. The compass in an Android is not very accurate or reliable, use your Brunton. The location coordinates can be accurate to several meters in a cell phone, I used to do this with a plane table alidade (later a transit), then I got a job. :astonished:

  • "IF YOU MAKE A COMPASS APP, TAKE THE DATA, STORE AND SHARE THE POINTS.. Well. The amount of ERROR reduce almost TO 0." Yes, you can combine datasets. You can also transfer the data to a spreadsheet and use a Google Spreadsheet on your PC at home. You can even consolidate (merge) the data from your 10 students.

  • i want to add the STEREOPLOTTING section. Why? Take a photo of the outcrop, note the azimuth of the camera, save to the Canvas, then use the drawing tools to sketch in the fault and other features. I don't know what you want to do in the Stereo plotting section. Just save the data, draw a sketch, take a photo, plot at home. Another Android programming tool can possibly create and rotate a 3d object Draw and rotate 3d bodies | B4X Programming Forum because it has access to drawing libraries that AI does not have. Perhaps that might be something you would want to do to visualize faults etc. Here is a thesis paper that discusses using App Inventor to work with 3d objects. https://dspace.mit.edu/bitstream/handle/1721.1/124236/1144934688-MIT.pdf?sequence=1&isAllowed=y

Here is another paper regarding 3D rotations
Using App Inventor extensions to implement rotation

Perhaps there is a way to visualize using App Inventor after all. :slight_smile: Can it be adapted to your purposes German?

Use your cell and its programs but don't forget to use your notebook too.

Some of what you hope to do is extremely complex. I once wrote a program for a laptop to planimeter, later made a small app to contour a surface from data points. Not sure I could reproduce it with Android using App Inventor (its drawing capabilities are limited). AI's graphics stink and are awkward to use but some researchers have found ways to do some interesting things.

Some things can be done with App Inventor; some are simply too complex.

Good luck.

1 Like

Steve.
Thank you for all your help.

I have some friends working in LAS HERAS and i know the patagonian landscape and weather, but now i live in the center plains of Argentina, not the south :slight_smile:
For your help... I owe you some alfajores santafesinos (a candy) and a few beers from my province.
Well. I started this life as programmer and then i transform in Geologist, to return to a programmer-geologist kind of mix.
In the earth science many scholars doesn't like the OVER use of the technology, some are RUSTY... DUSTY.
But this are tools, for make a BETTER measurement, the human are impossible to replace, because we must make ASSUMPTIONS AND MAKE HYPOTHESIS OF THINGS HAPPENING TO THE EARTH (until now... maybe in a future other planets!!!), i am too optimistic.
Off couse i have my regular compass, i use the wulf net, and i take all the notes. But i think this tool, could be a DOUBLE CHECK SYSTEM. i Also think to use ----------->Differential GPS, for EXTRA-HYPER-MEGA-ULTRA PRECISION MEASUREMENT :smiley:

And that's the 2nd catch. I think i can connect with ESP32 or Raspberry pi Zero or Pico, with this GPS. (This things i have in mind).
The regular compass have some bad readings. But i have a good commercial phones with Military standard 810g. Well. I found them VERY GOOD for the use in the field. (even if the phone fall to the earth, the earth is damaged :slight_smile: I also have in mind a phone with Iridium, for when i make my consulting.

Speaking...I also program for ZX Spectrum-Commodore 8bit computers, I have worked with sketchware (similar to AI2), and works well, i used Kodular with bad experiences, I am learning Python and microPython. I know a little of Java and Kotlin (little), but i am planning to solve it with time.
.
For ZX i even used Many kind of Basic, Prolog, Lisp, Forth, Machine code and Assembler. (But now i am too old for do that ASM i mean), and i use some engines like AGD MPAGD, SEUD and others to develop (games for 8 bit computers as a hobby).
. When i was in the University i had worked with R, but i didn't count. It's too academical to use in daily life. And with all other languages, all i can use it for fun too. (R don't)

I have the app GPS-compass-dbase working. Only need the stereo plotting part, but seems i must do it in parts. 1 for taking the data and 1 for the stereo plotting.
I used the mplsetereonet pack and its EASY for plot some points, but make a dbase, store, an register is another thing. I never use it for make a complex program. And less port to android. (i think i will go in that way, but with time, not now)
.
About this post...

.
I read it some months-weeks ago, because i want to make a (SIMILAR) app, but for Geochemestry. FOR SOIL, we use the USGS chart, with some variants. But we use some European classifications too, and sometimes is a mess. For color we use an French classification with Argentinian variants.
The same happens to me, with Gauss Kruger notation for coordenates.
I found a user who have an extension.... BUT GAUSS KRUGER is like a way of measurement, NOT A SINGLE UNIQUE WAY.
Example of that, Russia have a lot of bands and use SK42, we use WGS84 and Argentina have 7 bands (i live in the 5th).
I look the extension, was REALLY EASY TO USE, but the data was bad for ME, because there is NOT AN STANDARD, will could be used but for other countries. (i asked to the developer to add MORE INFO BECAUSE THIS COULD BE A PROBLEM, BECAUSE IF YOU DO NOT CHECK, ALL THE DATA WILL BE BAD). Again. The extension works GREAT, but show bad data, data for use in other place, because the coordinates aren't what must be. I triple check, and i know the coord, because i recorded for ME, and there were of my town monolith for gauss kruger national system.
.
My app for soil, recognize (Color), not size of grain, and this app could and seems to get tuned for, but also is interest.
.
I was making a sketch board (like the paint pot) but different, for sketching maps in the field.
BUT, i need a menu for sprites (to add the different references), for mapping. I also doesn't find anything like this. I want to drag sprites and get into a canvas. like traces (reference graph) for a handwrited map... like a treasure map? you can use some sprites to show, where is the Treasure (fault?, kind of rock, train, route, dan, etc ), with different kind of colors for different kind of rocks.
Well. I am in a pause, because i am watching if i can add this menu with sprites for use in the map app.
.
Now i am developing an app for stratigraphy.
Like a dbase. And then get the log with all of the strata inside.
This also, is didn't find any app for academical and or COMMERCIAL TOO.
Maybe for commercial there are... I didn't find it.
.
Well Steve. Thanks a lot for all the references you make, they point me in a way to continue reading and learning.
And if you come to Argentina, write me and if i can, i will give the cervezas and alfajores i own you!.
.
Thanks again.
Germán.

Never had that. In Comodoro Rivadavia had dulce de leche (next best thing to my grandmother's apple strudel). Looking forward to alfajores. If you get to Dallas, my wife might treat you to her version of strudel. :slight_smile:

As you make progress on your Project(s), please post again.
--Steve