Possibly an easier way to do this is to use a google gauge chart?
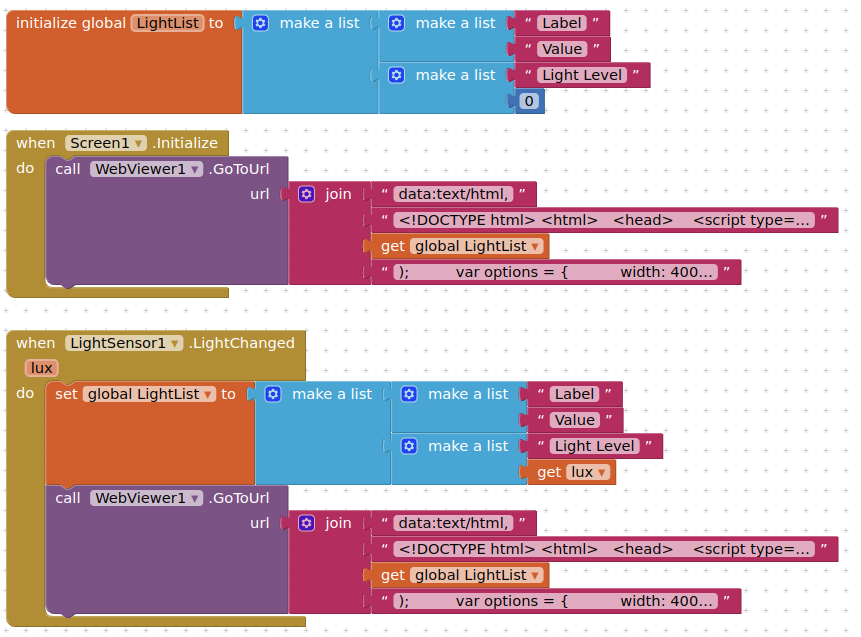
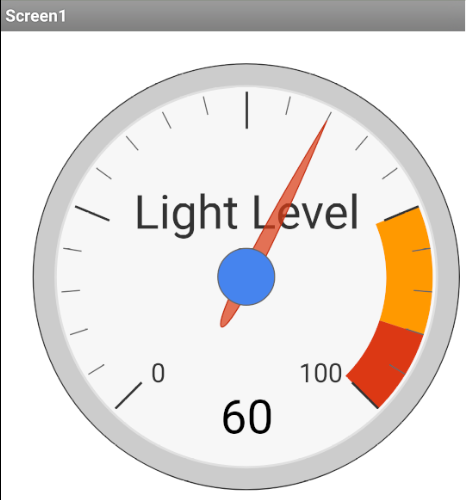
The two parts of the html:
<!DOCTYPE html>
<html>
  <head>
   <script type="text/javascript" src="https://www.gstatic.com/charts/loader.js"></script>
   <script type="text/javascript">
      google.charts.load('current', {'packages':['gauge']});
      google.charts.setOnLoadCallback(drawChart);
      function drawChart() {
        var data = google.visualization.arrayToDataTable(
light list goes here
);
        var options = {
          width: 400, height: 400,
          redFrom: 90, redTo: 100,
          yellowFrom:75, yellowTo: 90,
          minorTicks: 5
        };
        var chart = new google.visualization.Gauge(document.getElementById('chart_div'));
        chart.draw(data, options);
      }
    </script>
  </head>
  <body>
    <div id="chart_div" style="width: 400px; height: 120px;"></div>
  </body>
</html>