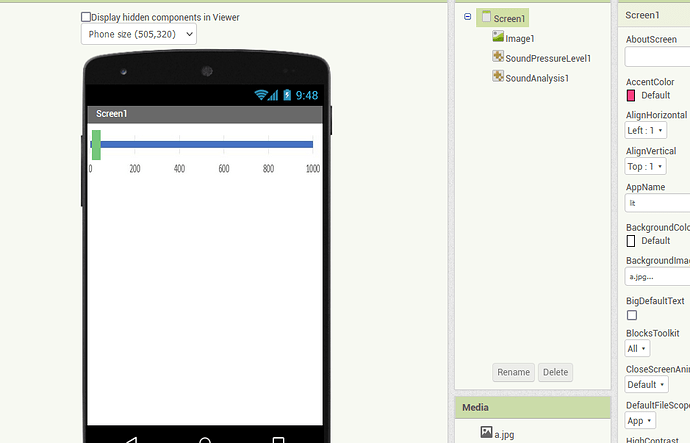
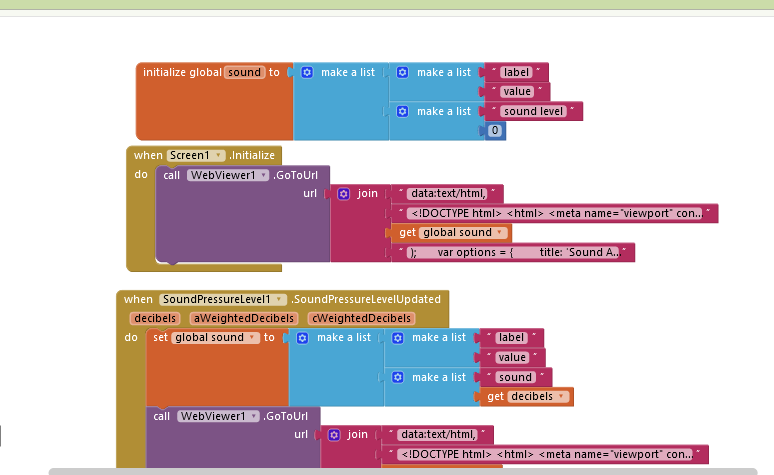
I want to move by analyzing the ambient sound of this indicator
What code do I need in the block?
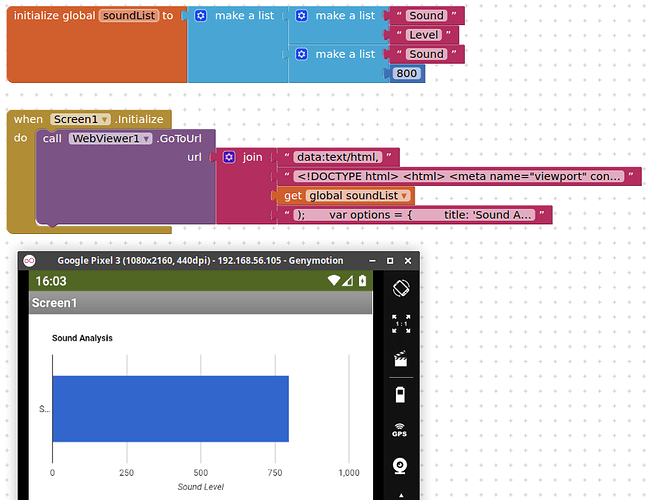
Using the same method that I used for showing the light meter in your other topic, how to display the sound level:
<!DOCTYPE html>
<html>
<meta name="viewport" content="width=device-width, initial-scale=1.0, maximum-scale=1.0, user-scalable=no">
<head>
	<title>BarSound</title>
	<script type="text/javascript" src="https://www.gstatic.com/charts/loader.js"></script>
</head>
<body>
	<div id="chart_div"></div>
	<script>
	google.charts.load('current', {packages: ['corechart', 'bar']});
    google.charts.setOnLoadCallback(drawMultSeries);
function drawMultSeries() {
      var data = google.visualization.arrayToDataTable(

//replace this section with your list and live value
[ ['Sound', 'Level'], ['Sound', 800] ]
// live value here = 800

);
      var options = {
        title: 'Sound Analysis',
        legend: {position: 'none'},
        chartArea: {width: '90%'},
        hAxis: {
          title: 'Sound Level',
          viewWindow:{
          max:1000,
          min:0
          }
         },
      };
      var chart = new google.visualization.BarChart(document.getElementById('chart_div'));
      chart.draw(data, options);
    }
	</script>
</body>
</html>
How should I put this code in the block?
Any way I do it is not right 
What does not work, simply no chart shows up, at all?
Not just a blank page
<!DOCTYPE html>
<html>
<meta name="viewport" content="width=device-width, initial-scale=1.0, maximum-scale=1.0, user-scalable=no">
<head>
	<title>BarSound</title>
	<script type="text/javascript" src="https://www.gstatic.com/charts/loader.js"></script>
</head>
<body>
	<div id="chart_div"></div>
	<script>
	google.charts.load('current', {packages: ['corechart', 'bar']});
    google.charts.setOnLoadCallback(drawMultSeries);
function drawMultSeries() {
      var data = google.visualization.arrayToDataTable(
soundList
);
      var options = {
        title: 'Sound Analysis',
        legend: {position: 'none'},
        chartArea: {width: '90%'},
        hAxis: {
          title: 'Sound Level',
          viewWindow:{
          max:1000,
          min:0
          }
         },
      };
      var chart = new google.visualization.BarChart(document.getElementById('chart_div'));
      chart.draw(data, options);
    }
	</script>
</body>
</html>
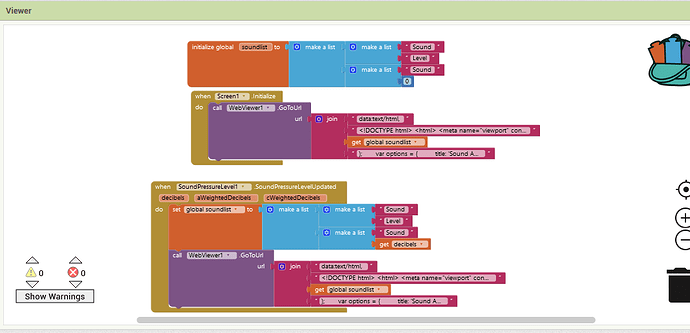
You should also check the values coming back as decibels, they may be quite small, using a different scale to 0 - 1000....
Now he came
But I think it is not connected to the voice recognition sensor because it does not increase the sound of its effective environment
noone? 

duplicate topic ...moving
I understood to mean that the graph was now working?
Did you check the values being returned by the sound analyser ?
No not working
In a fixed value
Remaining constant value
I want to adjust the ambient sound
I realise that, I simply wanted to check if the basic setup worked.
Yes, it worked


