I just discovered to plot two curves simultaneously with ChartMaker the values must be as shown
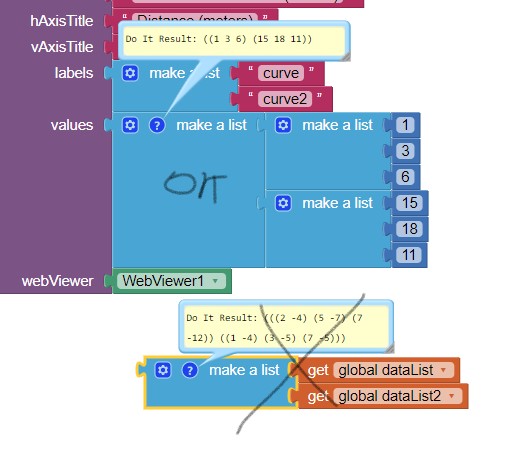
Providing two lists of pairs, does not work as shown by the x mark. Sorry for the advice w.r.t. a second graph on the chart. What would the second graph chart? the non filtered data or what?
-1 (rssi strength) , 1.40 (distance in meters)
0, 1.00
-2, 1.50
-1, 1.00
you can only have numerals, not the rssi strength, distance in meters annotation.
Exactly. You cannot use a Line Chart to show what you want to show. Your graph should show only points because if you use a line chart, the assumption is you move progressively away . The ChartMaker unfortunately cannot create a graph like that where you a close, then faraway, then nearer etc.
Yes, and you can measure distance; you just cannot plot distance on a graph the way you expect.