Limited number of points to be plotted in a graph

Hi Everyone,

I need a small help with a line graph.

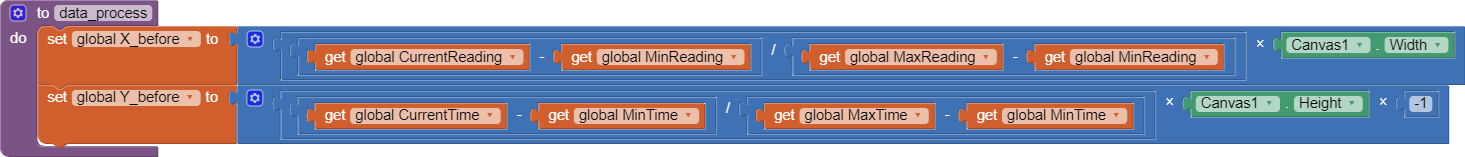
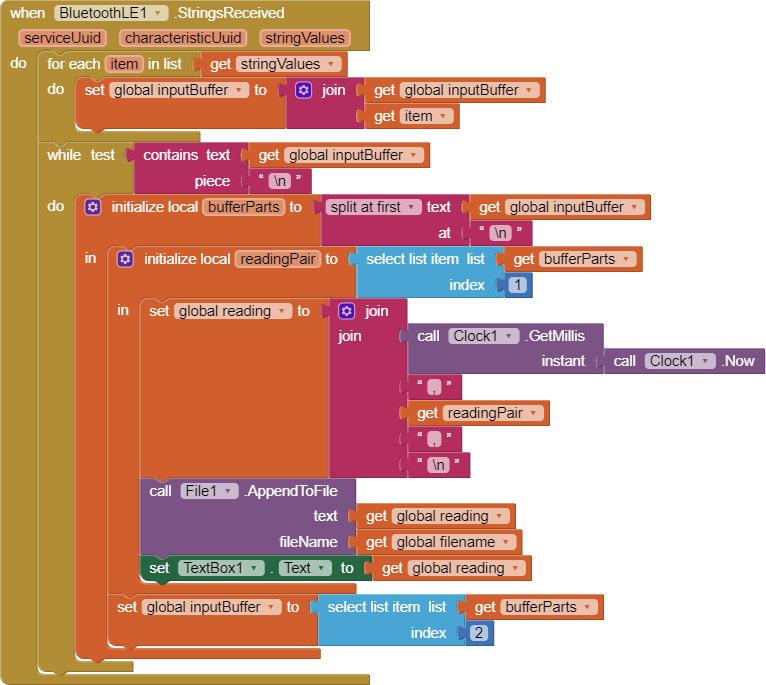
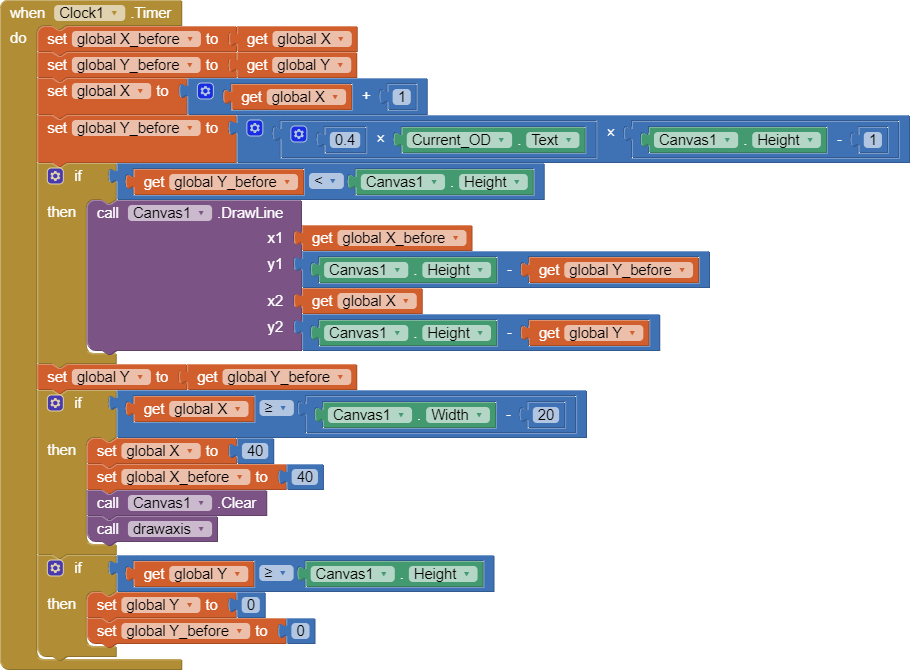
I need to plot a line graph (time vs data) with y-value increasing over time for two hours. The app is collecting experimental data. My current app works by updating the canvas at every second. However, by the time it reaches 100 seconds or so, the app stops updating the graph as it reaches the edge of the smartphone’s screen width. I need to run this app for 2hours or more. How can I solve this issue. Scrolling to left is not an option. I want to see the data for the entire duration at all the times. Basically, I would like to see how the y-value is increasing with time for the 2 hours in real time. I attached my blocks here as an editable PNG file for reference.

P.S: I followed the FAQ section on graphs and after trying multiple things, I settled on the current version of blocks.

Many thanks in advance.

1 Like

If you want to see the entire run, you need to set expected min and max reading values, for scaling.
You also have to decide what you want to do if the reading goes off scale. Do you wan to clip,
or do you want to rescale and redraw?

This applies to both x and y.

1 Like

Dear Abraham,

Thanks for the hint. I will work on that. I would like to rescale and redraw, if it goes of the scale.

To rescale and redaw, you will need to save all your (time, reading) pairs for this session.
You can do this with 2 lists, starting from empty, keeping them parallel:
Time(i) and Reading(i) , i = 1,2,3…

Clock1SystemTime in ms is good for Time(i), no formatting complications.

Keep global minReading and maxReading as you collect readings, to avoid rescanning.

minTime and maxTime are at first and last slots of the Time() list.

To turn readings or time into x or y,

  • subtract minReading or minTime(as appropriate) to get base 0,
  • divide by (maxReading-minReading) or (maxTime-minTime) (as appropriate), then
  • multiply by (Canvas Width or -Height), as appropriate.

The -Height is because y goes down.

1 Like

I tried my best to understand your instructions and follow them, but I couldn’t.

All I can do is below blocks. Could you please help me further.

1 Like

Since, I could not go further with the canvas type of chart, I searched in the forums to find a better way of plotting the data. One thing, I realized is that I can use the chartmaker extension with CSV data. I tried the example from the below link and I was able to get the app working with the given data.
https://community.appinventor.mit.edu/t/cant-select-ble-component-from-list/4818

It worked well. Now, my question is, since my data is time series data, How can I plot time data on x-axis. For example, I want to plot time (minutes) vs Values. Can someone help me how to convert my data, specially time data into minutes. My current data looks like the following

Feb 24, 2020,9:37:46 pm,V259,R255
Feb 24, 2020,9:37:46 pm,V263,R255
Feb 24, 2020,9:37:50 pm,V268,R255
Feb 24, 2020,9:37:50 pm,V266,R254
Feb 24, 2020,9:37:55 pm,V247,R256
Feb 24, 2020,9:37:55 pm,V260,R255
Feb 24, 2020,9:37:57 pm,V260,R256
Feb 24, 2020,9:38:01 pm,V257,R256

Why format the time in your file, if you only condemn yourself later to having to unformat it?

Dear ABG,

My values are not generated from the system, rather they are received from a BLE device. See the link below where you helped me to solve how to receive such data. Strings merged recieved from BLE are getting merged
So the values are not at uniform time intervals to use Clock1SystemTime to plot the time(ms) vs values. I also cannot think of how to implement this. Could you please point me towards such solution. I mean any previous example.

Hi ABG,

I am trying the blocks below. I will test this with my BLE device tomorrow.

That should work.

The milliseconds value will be very high since the base is 1970.

You can compensate for that at plot time by grabbing the milliseconds from the first row
and subtracting it from each row’s milliseconds value, effectively setting your time base to 0.

Thanks ABG, it is working.

This topic was automatically closed 7 days after the last reply. New replies are no longer allowed.