JSON Scrape -> Dictionary -> List -> CSV

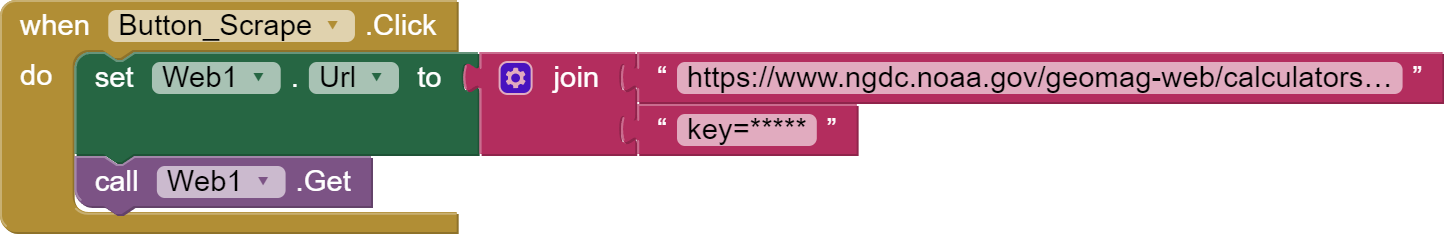
I'm scraping some NOAA data in JSON format using their WMM API. Scaping the data no issues.

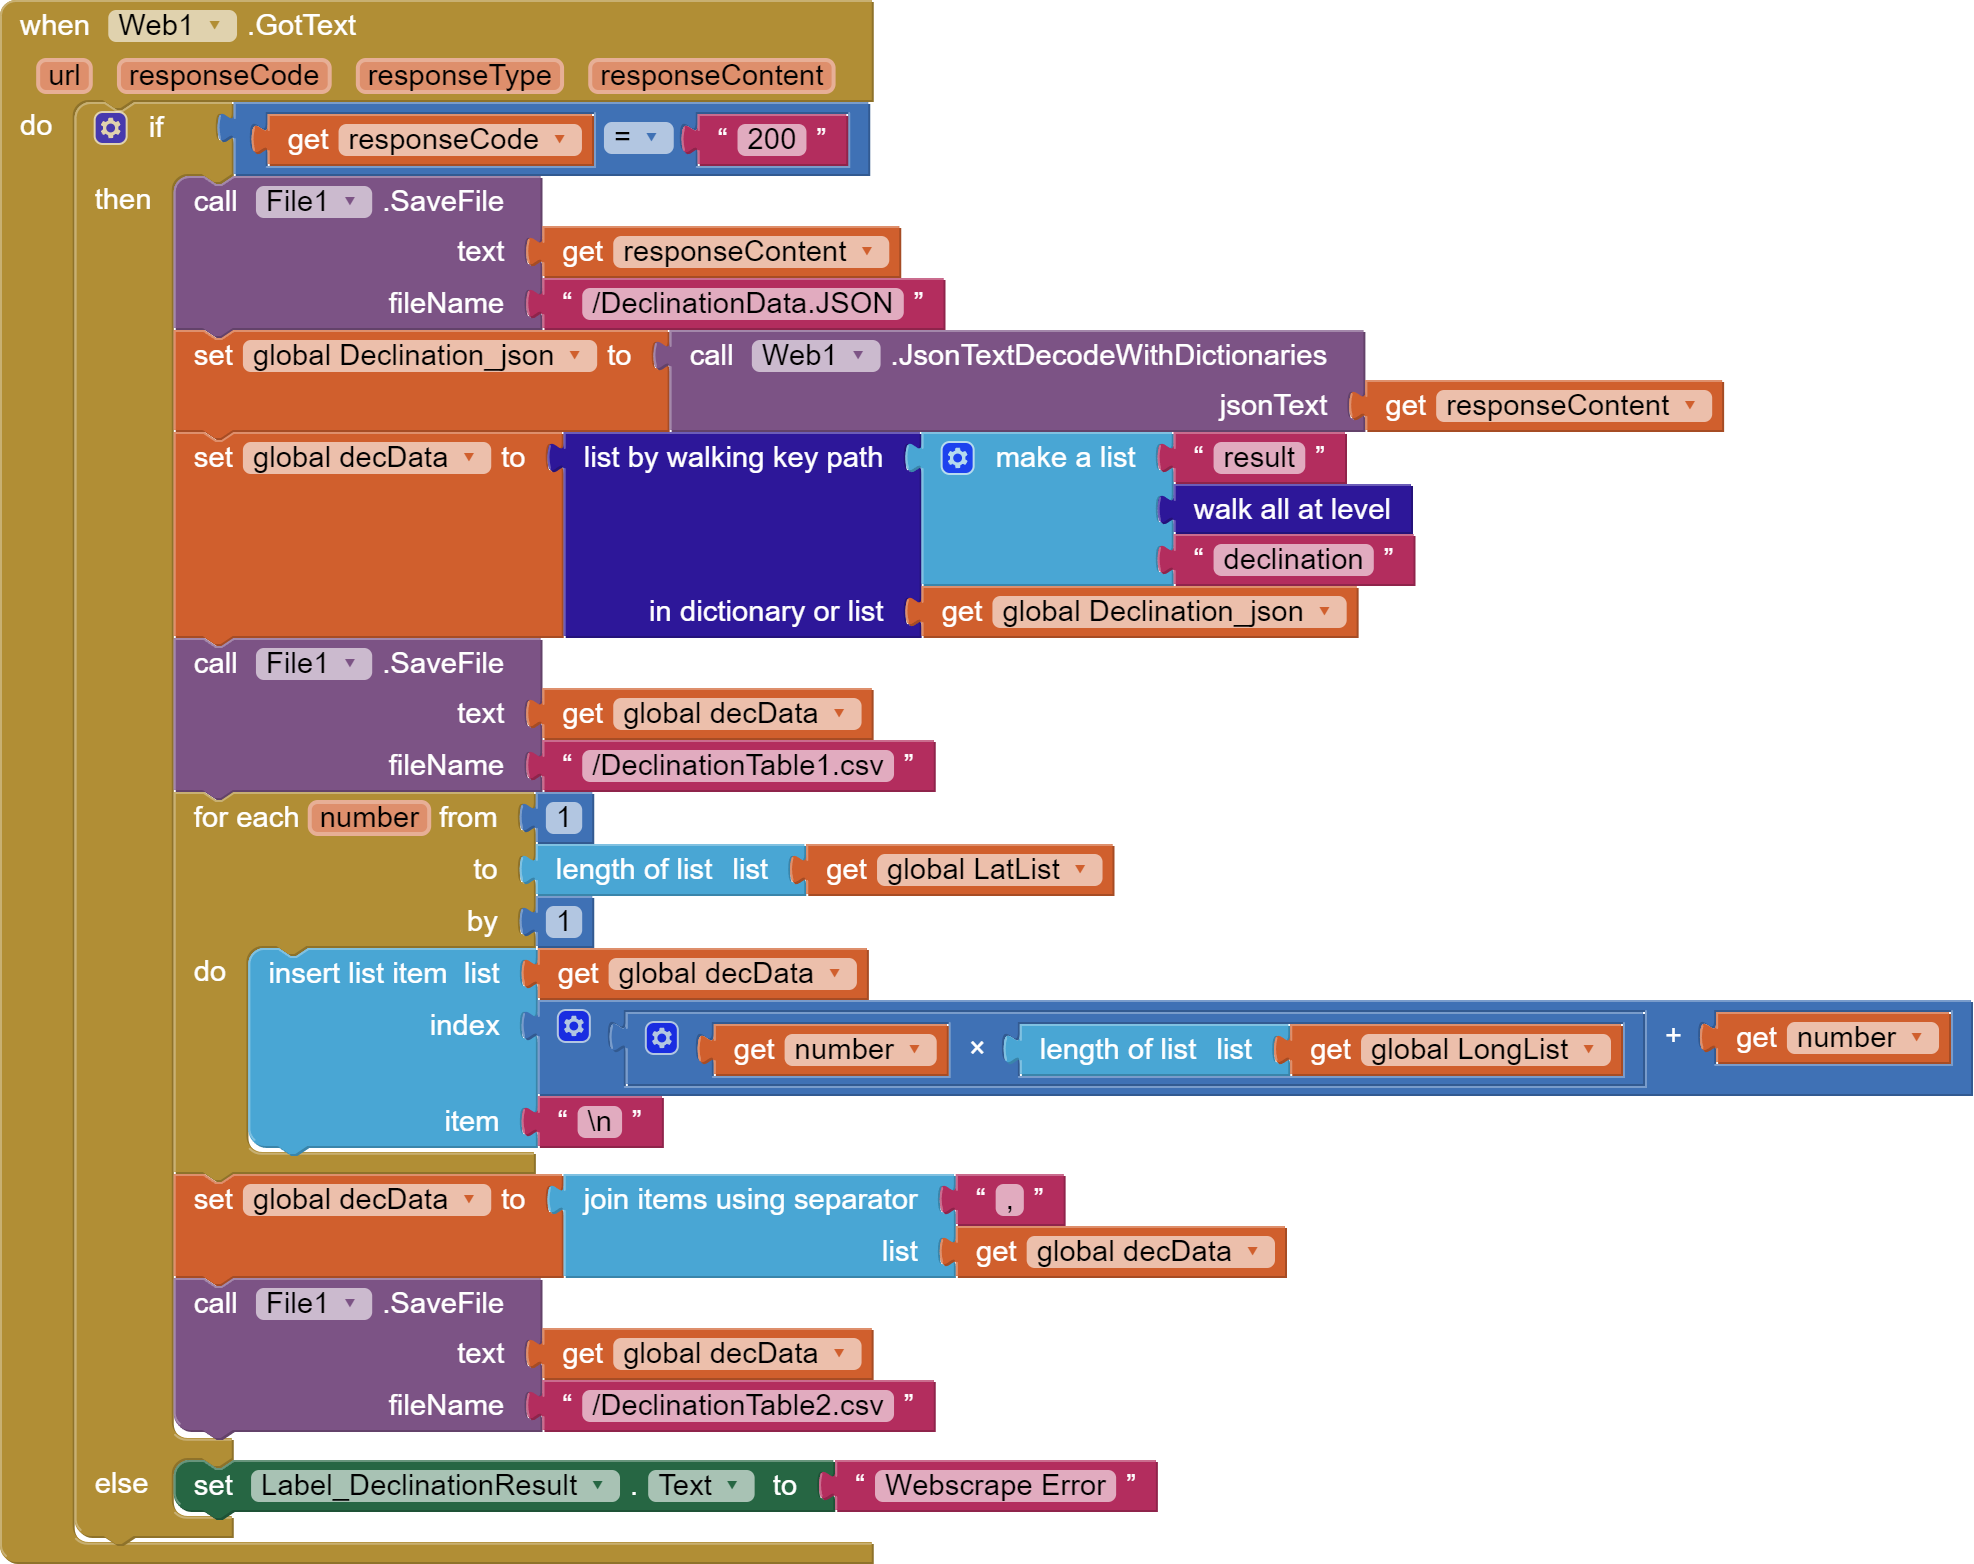
I'd like to grab all the declination data from the JSON and export it to a CSV table. At the moment, I'm walking the "declination" data into list and then splitting the list with a \n.

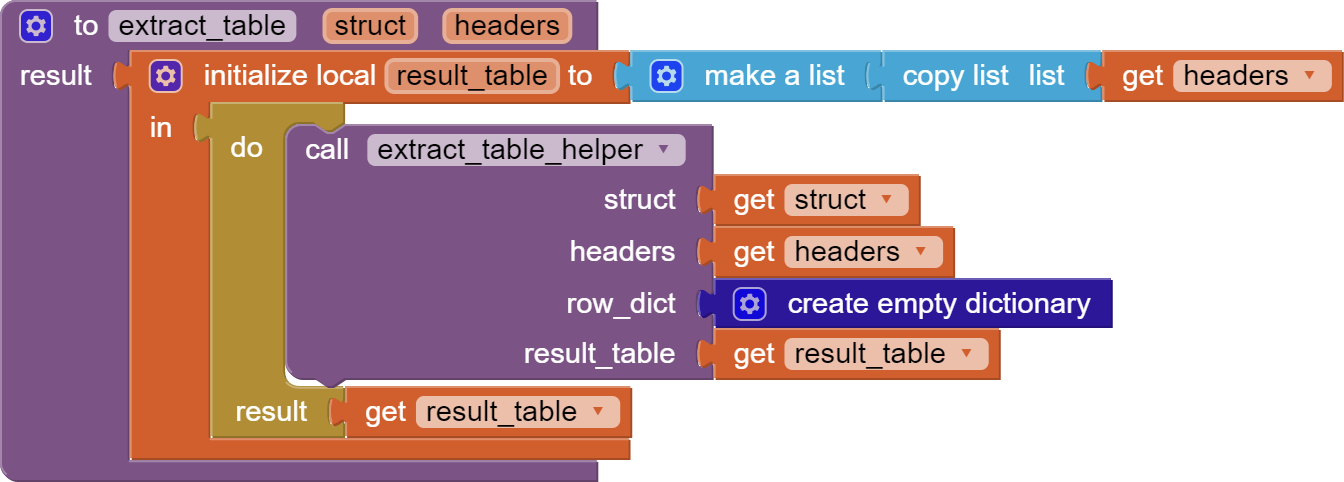
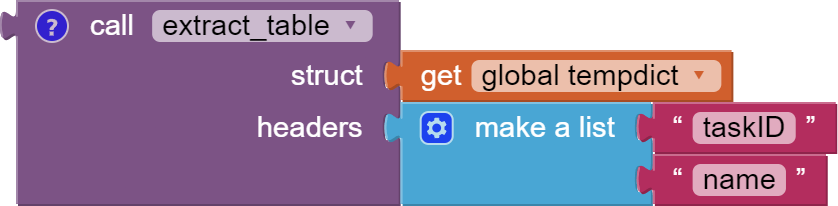
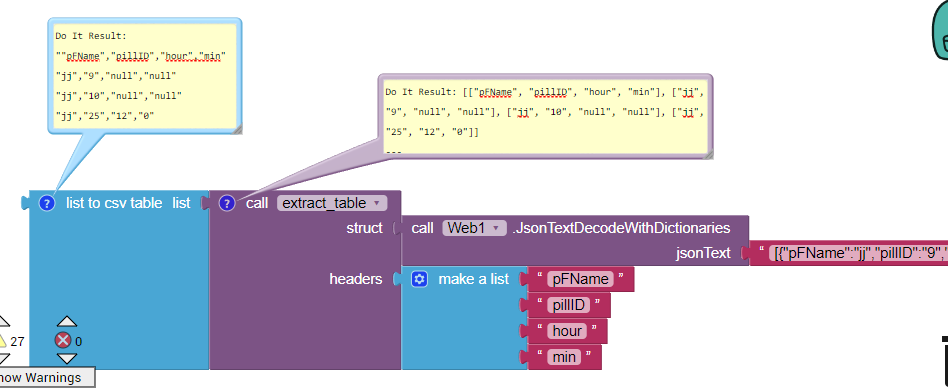
These are the principal blocks:

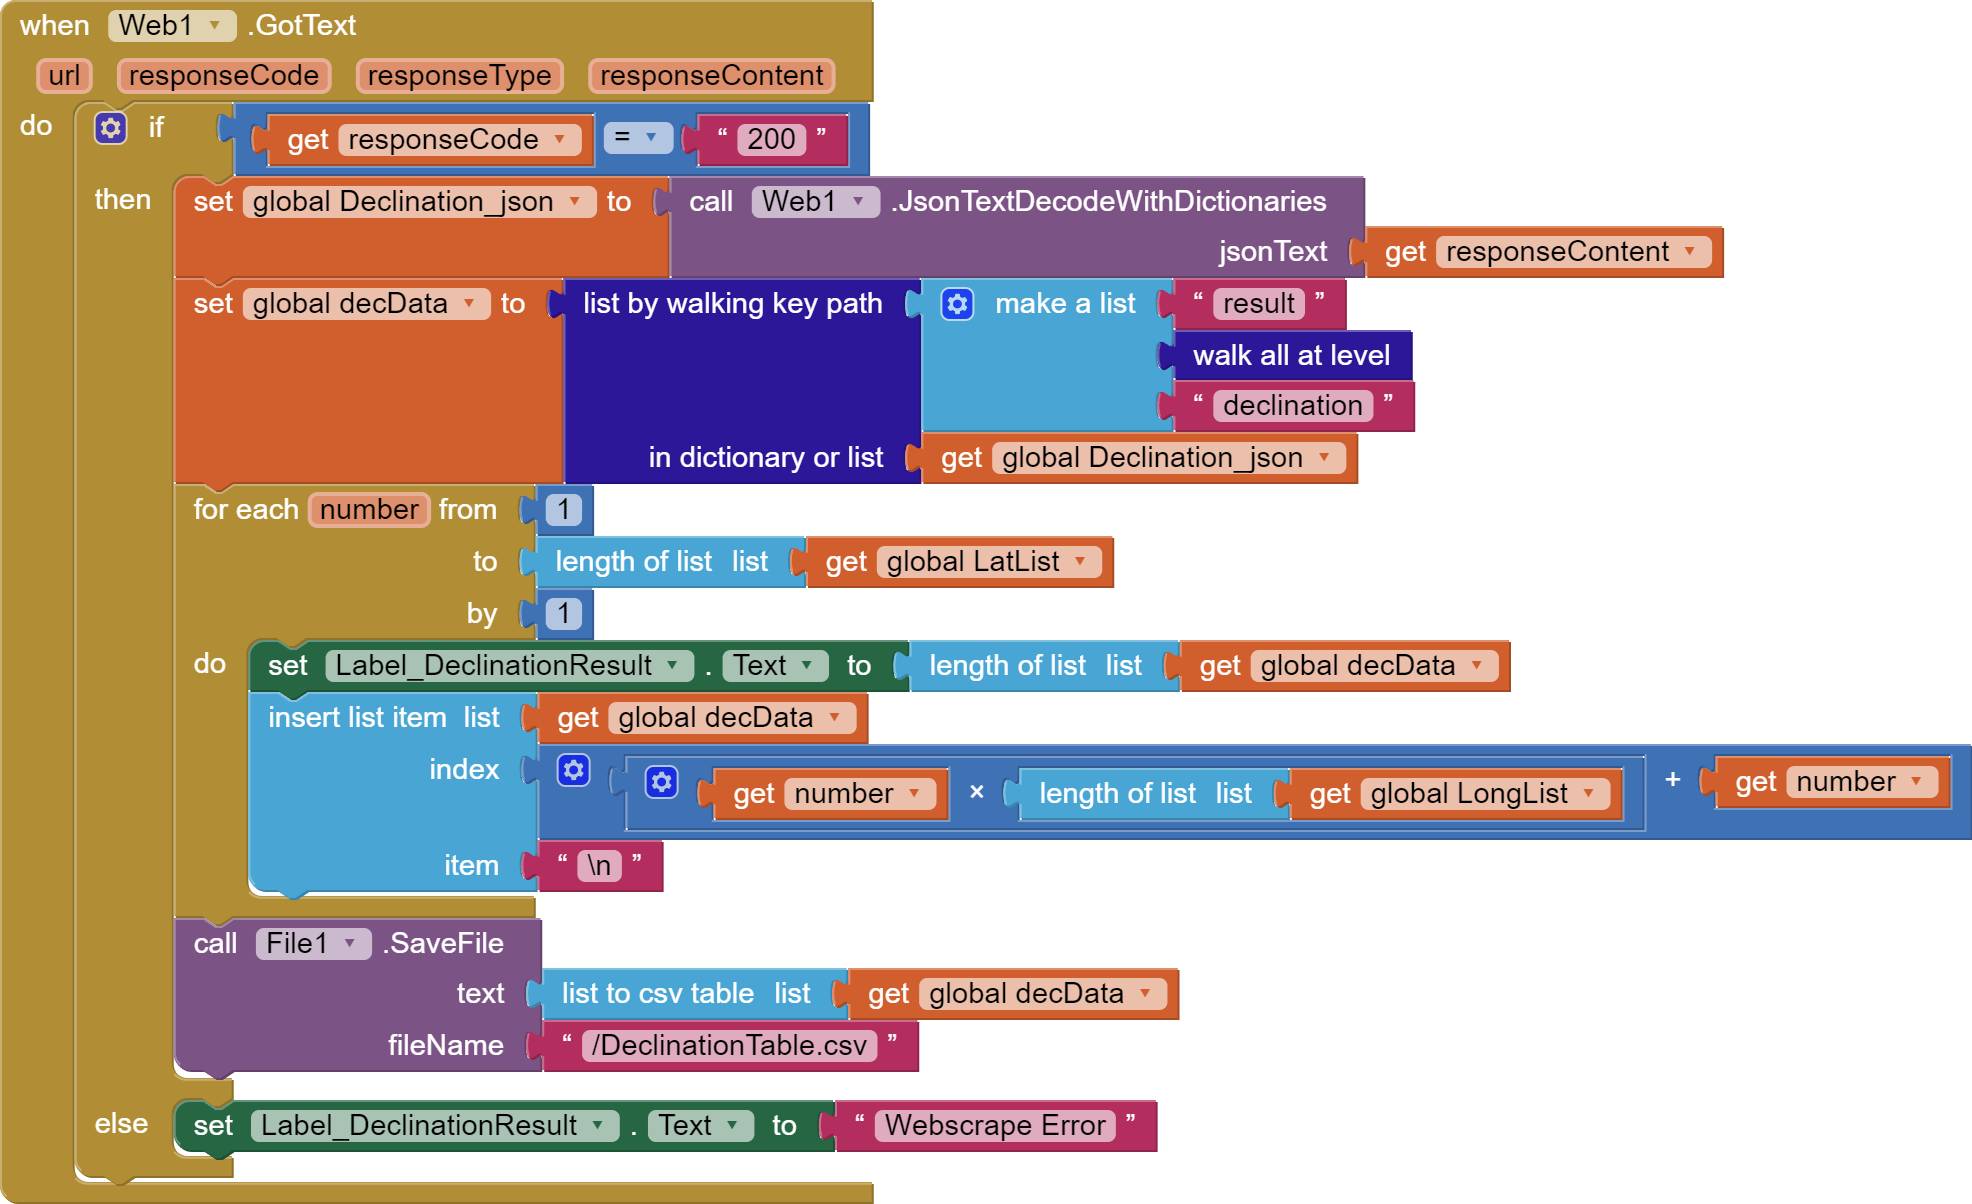
It's "working", however I believe i'm actually creating a list of lists here. When I read the CSV data, each declination value i've scraped is in "" and therefore each value is in its own row. The \n i'm inserting is then just inserting a blank row.

When I walk the dictionary, am I doing it in the right way and simply need to convert my list of lists back to a single list, or is there a better way to send the JSON "declination" values straight into a single list?

Bonus points for any hints on simplfying the process of getting the JSON scrape directly into the CSV.

Here is an example of the JSON for reference:

declination{
	"model":"WMM-2020", 
	"version":"0.5.1.11",
	"result":[	{	
  "date": 2023.7479,	
  "elevation": 0,	
  "declination": -21.33346,	
  "latitude": 85,	
  "declination_sv": -2.7678,	
  "warning": "Warning: location is in the blackout zone around the magnetic pole as defined by the WMM military specification (https://www.ngdc.noaa.gov/geomag/WMM/data/MIL-PRF-89500B.pdf). Compass accuracy is highly degraded in this region.",	
  "declination_uncertainty": 5.03157,	
  "longitude": -180	
},
	{	
  "date": 2023.7479,	
  "elevation": 0,	
  "declination": -19.87348,	
  "latitude": 85,	
  "declination_sv": -2.58591,	
  "warning": "Warning: location is in the blackout zone around the magnetic pole as defined by the WMM military specification (https://www.ngdc.noaa.gov/geomag/WMM/data/MIL-PRF-89500B.pdf). Compass accuracy is highly degraded in this region.",	
  "declination_uncertainty": 4.9491,	
  "longitude": -175	
},
	{	
  "date": 2023.7479,	
  "elevation": 0,	
  "declination": -18.69972,	
  "latitude": 85,	
  "declination_sv": -2.40869,	
  "warning": "Warning: location is in the blackout zone around the magnetic pole as defined by the WMM military specification (https://www.ngdc.noaa.gov/geomag/WMM/data/MIL-PRF-89500B.pdf). Compass accuracy is highly degraded in this region.",	
  "declination_uncertainty": 4.93419,	
  "longitude": -170	
},

I'm pretty sure i'm mixing lists and strings and csv nomencalture. I'll sleep on this and hopefully have a better idea of what i'm doing wrong in the morning.

How do you want your eventual csv file to look, if taking data from the json?

Do you need csv, or could you work directly from the json (dictionary)?

Here are some procedures you can call.

Don't modify them, just set up a call to the extract_table procedure.


P.S. These blocks can be dragged directly into your Blocks Editor workspace.

Dragging blocks

Sample calls:


Once you have the output table, you can use the csv_from_table block to cast it to CSV text, then write that to your output file.

From your JSON, I imagine you would want headers

  • latitude
  • longitude
  • declination

Attached is the raw JSON file and how I would like the CSV formatted. Note the JSON data i'm scaping is in degrees whereas my CSV i'm sharing is in radians. This is not an issue.

I don't necessarily need the CSV, but I have been using the method I've posted here:

and I need to be able to store the data offline in case my application has no data connection available at the time of use. An external (outside of the app assets) CSV seemed to be a logical extension of my original application.

Happy to explore the storage and direct use of the JSON and dictionaries to achieve the same outcome.

I've worked a bit more this morning on this. Almost have it right using the CSV method except:

  1. The formatting is not quite right. My blocks below are inserting the '\n' between the "-" symbol and the corresponding number. This means those numbers go from -ve to +ve and there's a "blank" cel created at the start of each CSV row; and
  2. My csv table is up-side down. (an easy fix I think).

*note: i've left some of the debugging code in here.

Thanks @ABG,

Have a look at the example CSV I posted above. That's how I need it to be formatted if I continue using the CSV method. No headers, just the declination data.

I also recall that there's a problem with the NOAA API (or a problem with me) that when I scrape latitude data starting at -90 degrees, the API returns incorrect latitude values starting at -89.999 degrees - and from then on all of the JSON stream is out of whack. As an interim fix, i resolved to start my latitudes at -85 degrees and run through to 85 degrees. I'm not planning to use this app within 5 degrees of either of the poles!

I looked twice, and only see JSON.

Remove item 1 from the output table before sending it into CSV conversion.

Sorry about that. Worse than email - not attaching files!

The JSON and CSV are here.

DeclinationData.JSON (508.8 KB)
DeclinationTable.csv (18.6 KB)

I don't see a table structure in your csv, only a long string of comma delimitted numbers.

But you mention you need to filter or modify your output based on latitude, so you would need at least two columns in the table coming out of the JSON conversion.

I imagine you would then post process the two column table to drop or fix bad rows, then just extract the column you want?

This is what the CSV looks like to me:


Interesting that even a form of declination pattern appears in spreadsheet format - but that's beside the point.

I thought the line breaks were some kind of pagination.

How do you get column number from the JSON?

And what does the column number mean?

I'm following a pretty basic process of columns being longitude ranging from -180 to 180 degrees and rows being latitude ranging from -85 to 85 degrees.

See my note above regarding the API glitch i'm experiencing WRT latitudes at the poles.

I can share the Python code that I used previously to scrape the CSV. It uses a cascaded loop to sequentially populate the csv. A bit inefficient and API call hungry.

You'll need to register your own API key if you want to run it.

import math
import json
import sys
import urllib.request
import os

SAMPLING_RES = 5
SAMPLING_MIN_LAT = -90
SAMPLING_MAX_LAT = 90
SAMPLING_MIN_LON = -180
SAMPLING_MAX_LON = 180

def constrain(n, nmin, nmax):
    return max(min(nmin, n), nmax)

LAT_DIM=int((SAMPLING_MAX_LAT-SAMPLING_MIN_LAT)/SAMPLING_RES)+1
LON_DIM=int((SAMPLING_MAX_LON-SAMPLING_MIN_LON)/SAMPLING_RES)+1

# Declination
params = urllib.parse.urlencode({'lat1': 0, 'lat2': 0, 'lon1': 0, 'lon2': 0, 'latStepSize': 1, 'lonStepSize': 1, 'magneticComponent': 'd', 'resultFormat': 'json'})

#key=sys.argv[1] # NOAA key (https://www.ngdc.noaa.gov/geomag/CalcSurvey.shtml)
key="*****"

f = urllib.request.urlopen("https://www.ngdc.noaa.gov/geomag-web/calculators/calculateIgrfgrid?key=%s&%s" % (key, params))
data = json.loads(f.read())

print('Downoading declination data and writing to file. Please wait...')

with open("DeclinationTable.csv", mode='w') as f: #creates a new csv file "w" overwrites any previous file.

    for latitude in range(SAMPLING_MIN_LAT, SAMPLING_MAX_LAT+1, SAMPLING_RES):
        params = urllib.parse.urlencode({'lat1': latitude, 'lat2': latitude, 'lon1': SAMPLING_MIN_LON, 'lon2': SAMPLING_MAX_LON, 'latStepSize': 1, 'lonStepSize': SAMPLING_RES, 'magneticComponent': 'd', 'resultFormat': 'json'})
        f = urllib.request.urlopen("https://www.ngdc.noaa.gov/geomag-web/calculators/calculateIgrfgrid?key=%s&%s" % (key, params))
        data = json.loads(f.read())

        with open("DeclinationTable.csv", mode='a') as f: #"a" means to append - this will write each line, one after the other.
            f.write('  ')
            for p in data['result']:
                # declination in radians * 10^-4
                declination_int = constrain(int(round(math.radians(p['declination'] * 10000))), 32767, -32768)
                f.write('{0:6d},'.format(declination_int))
            f.write("\r")
        print('Latitude: ',[latitude])

print('Finished.')
os.system('pause')

Is the 360/5 = 72 column format a real requirement, or is it inheritted, like

?

It could be 360/10.

Because i'm processing the data in-app using bilinear interpolation I felt like 5 degrees was an easily manageable dataset size and would provide a good degree of accuracy through interpolation.

I've not undertaken a strict analysis comparing the WMM against my interpolation method to determine the sweet spot.

That wide format for the csv makes it harder to filter, compared to a 3 column (lat,long,decl) format.

Were you planning on carrying around printed wallpaper charts from that csv?

I'm not sure you've picked up on how the data is being used in the next steps if the process. Please refer to this method I've been using successfully:

Sorry, this is a deeper dive than I expected.
Maybe tomorrow for me.

Yeah, it's fairly novel in this space from the limited resources i've been able to piece together. I'm confident that we as a community will get there with the simplest and easily understandable approach though.

A post was split to a new topic: Want to create Speed camera