To get the calibration, I have known concentrations of gases to get their response; then, I can detect unknown gas concentrations.
@ABG Thank you so much; now screen 4 is working.
I will get the calibration from known gases concentration by getting their SR response in a normal situation of R vs t to get R gas and R air in screen 1, then, i will add them in screen 4 to get the concentration of unkown gases.
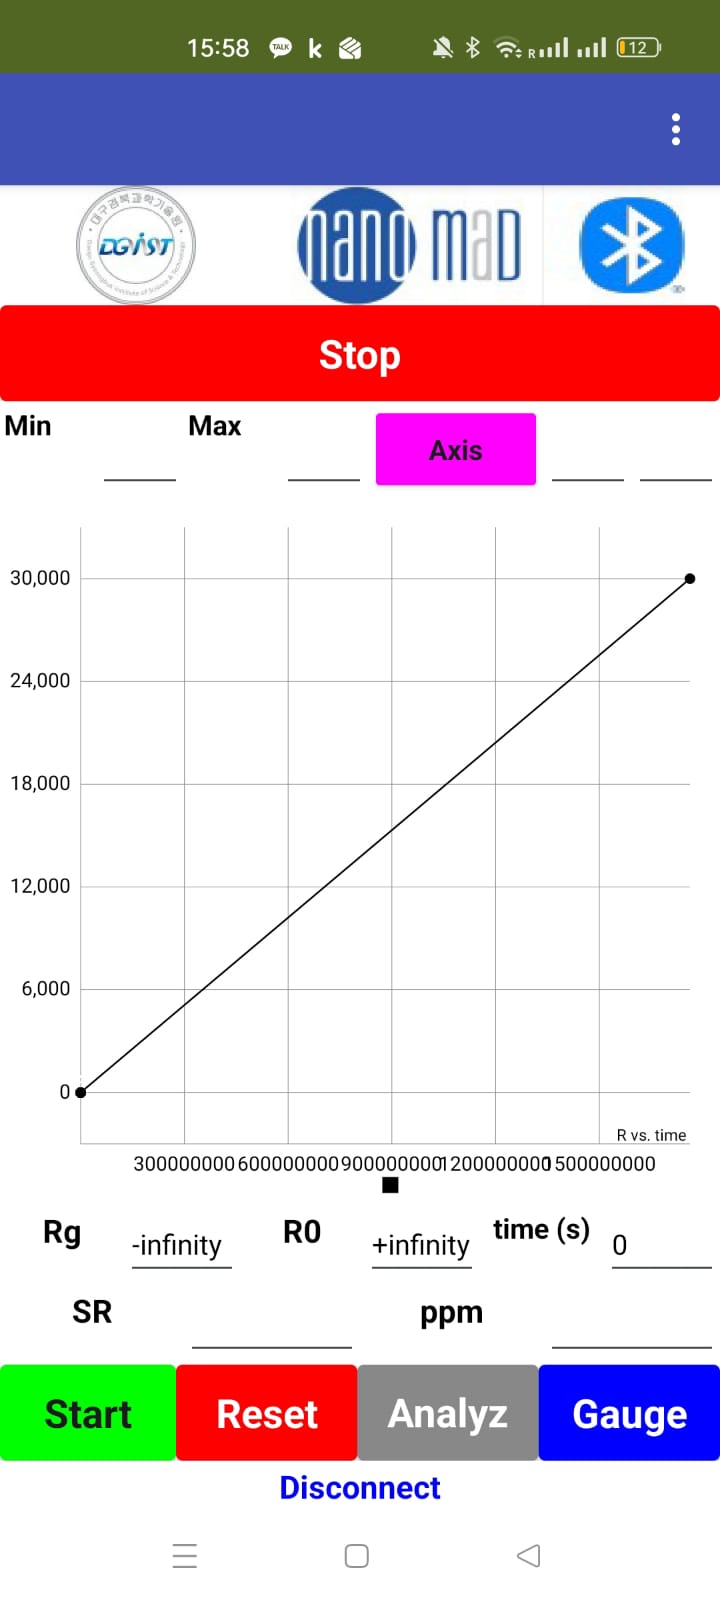
I need the calibration to calculate the ppm of the unknown gases. So first I will receive voltage from ESP32, and the resistance will be mathematically calculated from voltage by the Wheatstone bridge. After that, the resistance will be plotted to get Rg and Rair by the Analyze button, which has to work by clock, not by pressing, and from them I will get the response by dividing Rg/Rair or Rair/Rg, depending on the gas and material type. Also from the calibration screen, I will get the slope, which will be used to calculate the ppm, and also I need to rotate the gauge automatically.
Hello @ABG
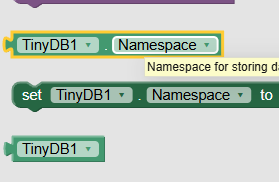
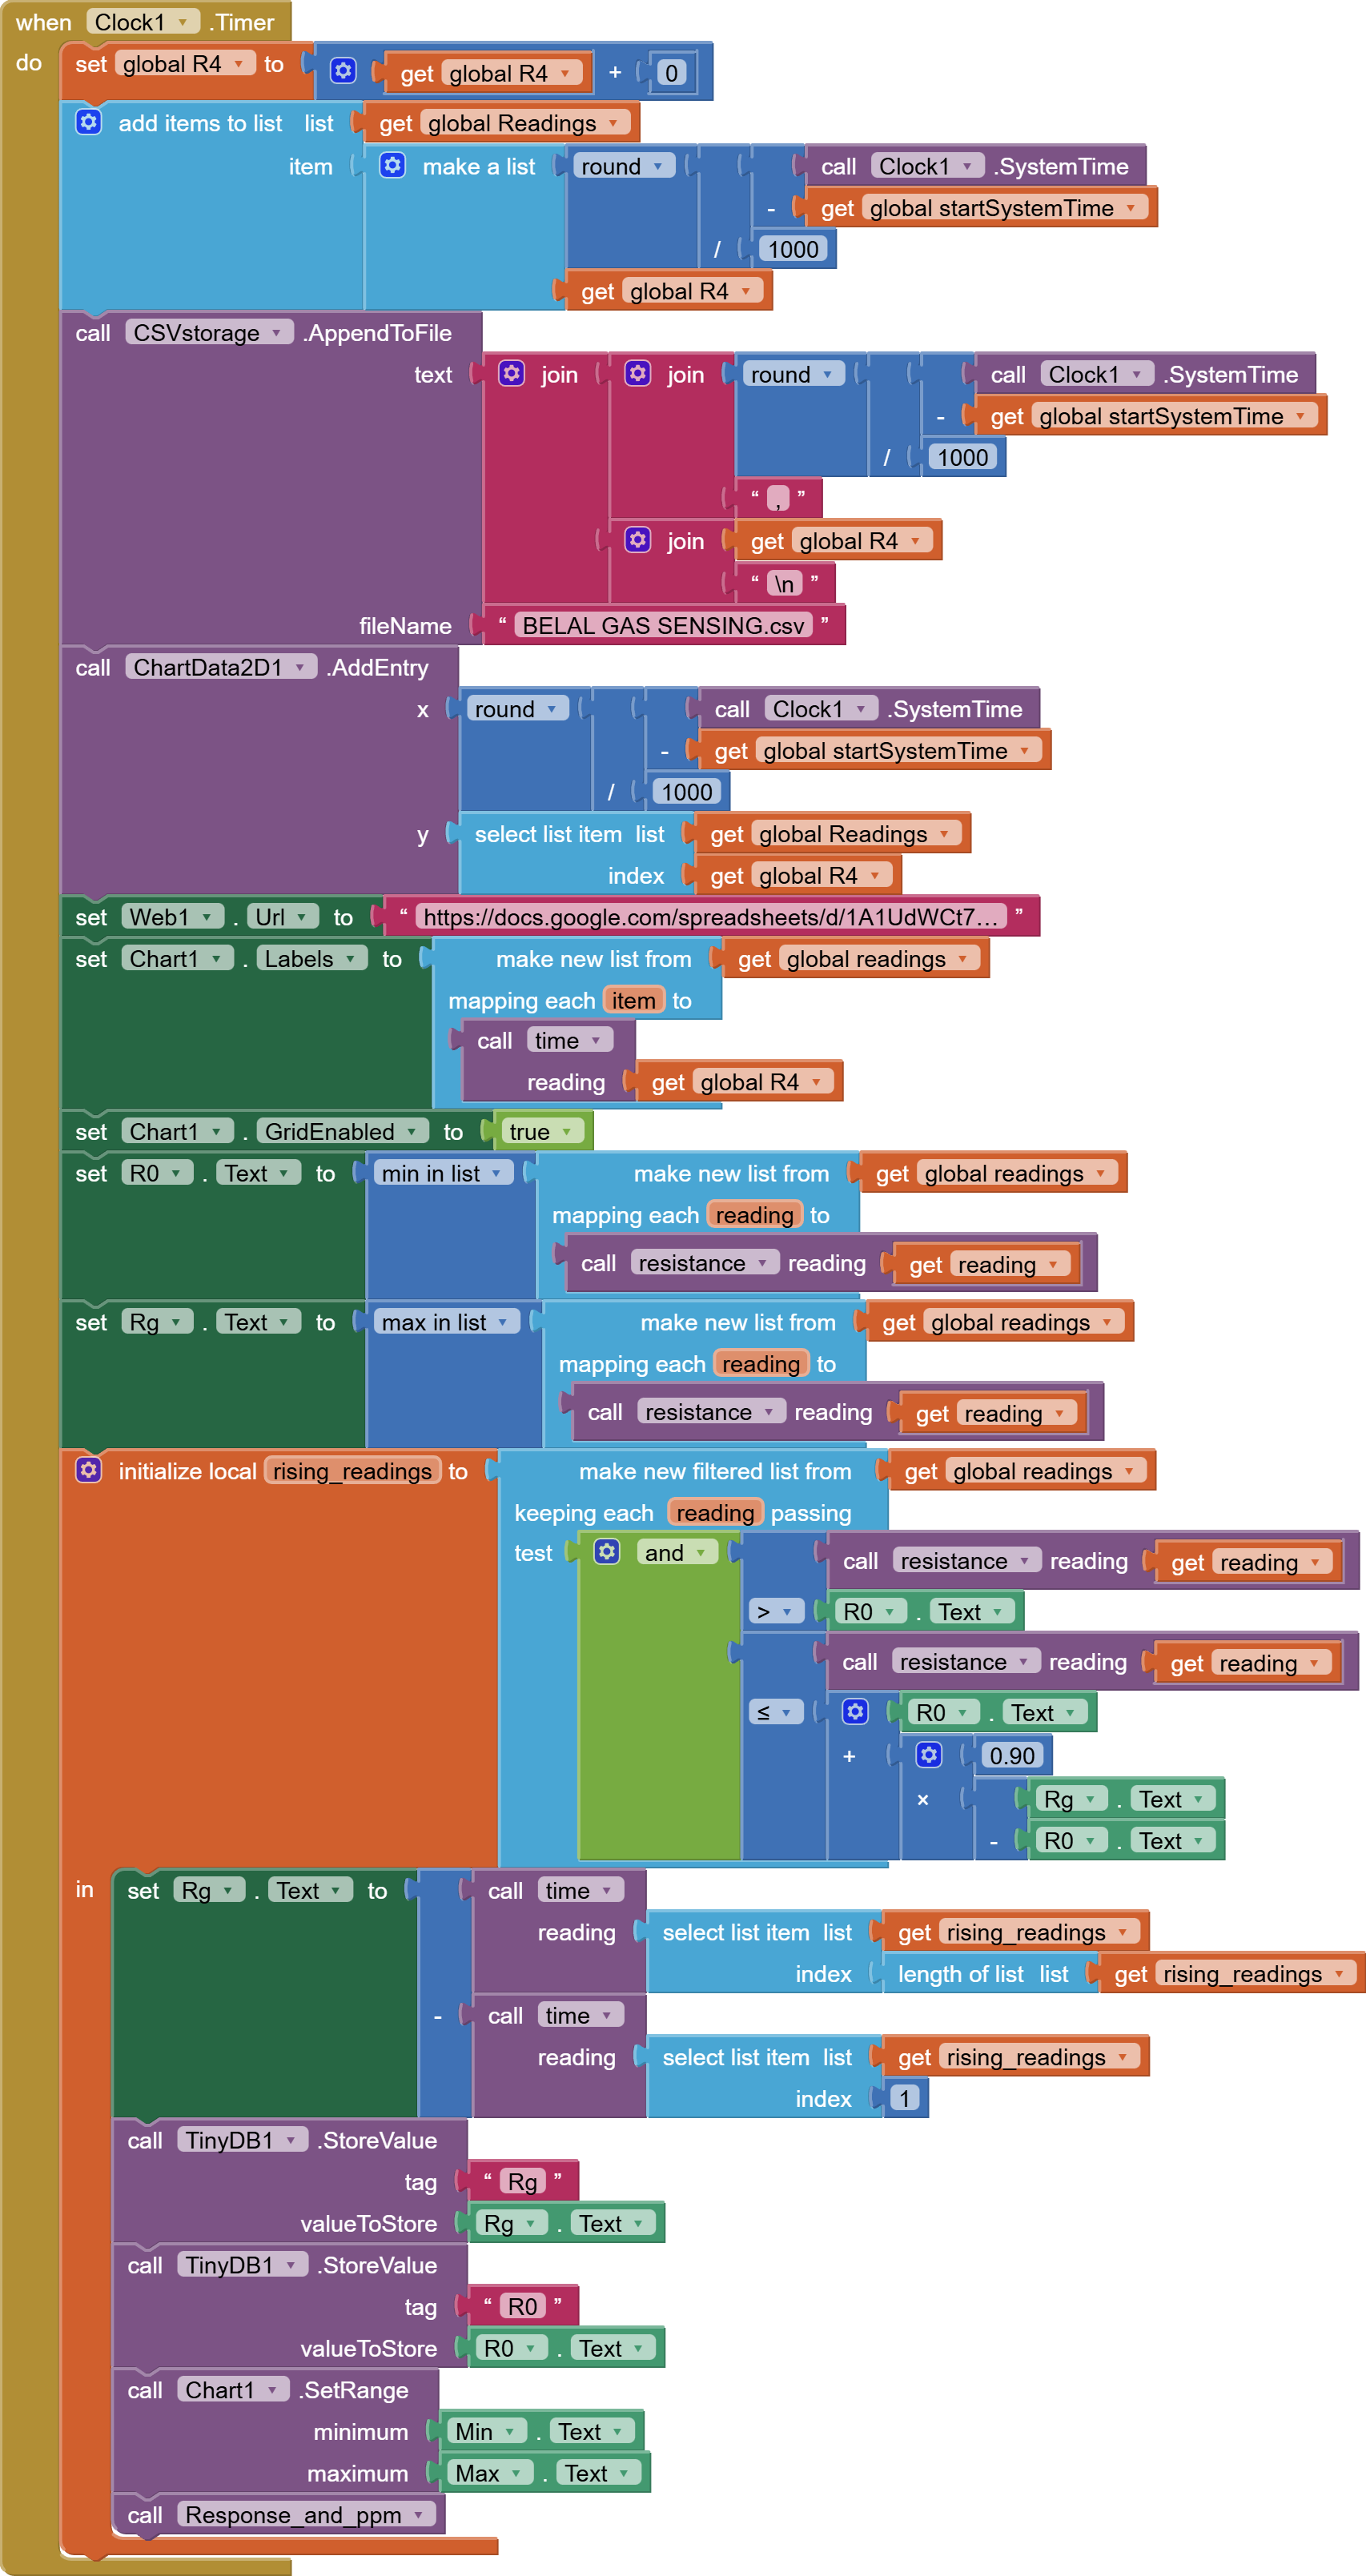
Please I have tried to use a dictionary to save the data and recall R4 again on screen 1 from screen 3, which is the y-axis in the chart, but it does not work. Furthermore, I used tinyDB4 instead of DB1. I used the entry click to get x and y axes, but they are in text boxes, and I need them on the graph itself.
For your question, this app is for a resistive gas sensor for one gas only for this time; next time I will plan to make it for different gases.
Sorry, in the first I did not get it, I will change it now, I am so sorry
Prefinalappgassensing (2).aia (333.9 KB)
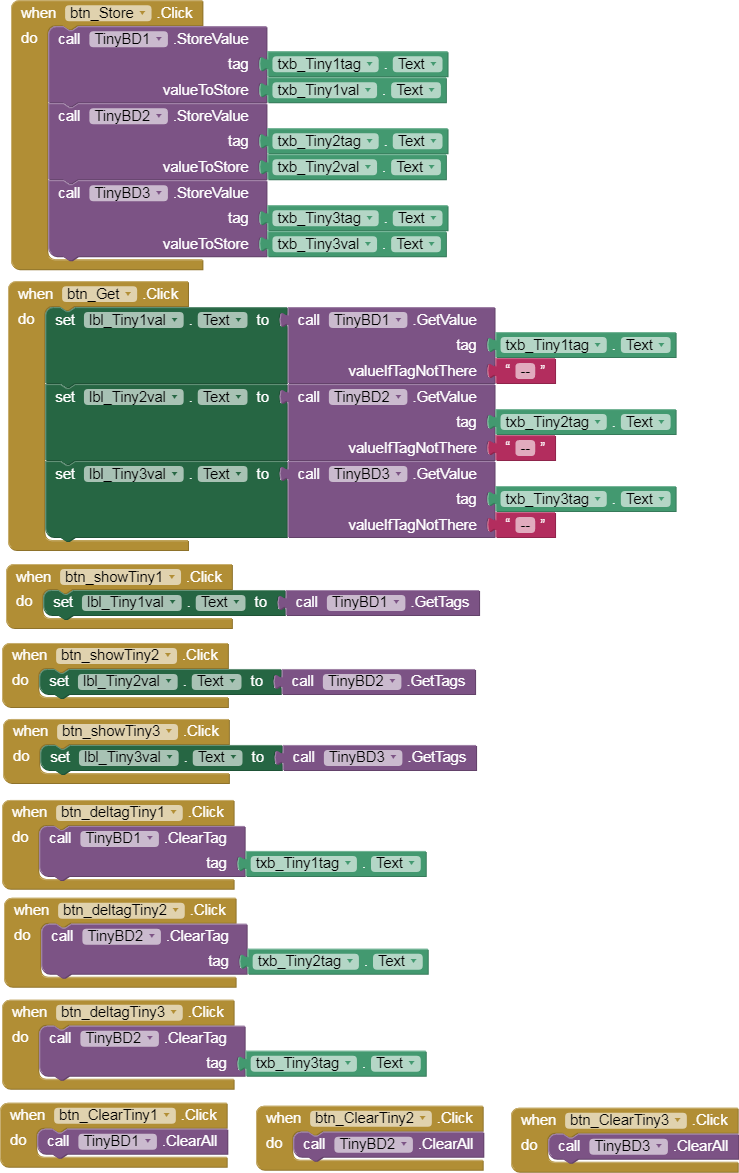
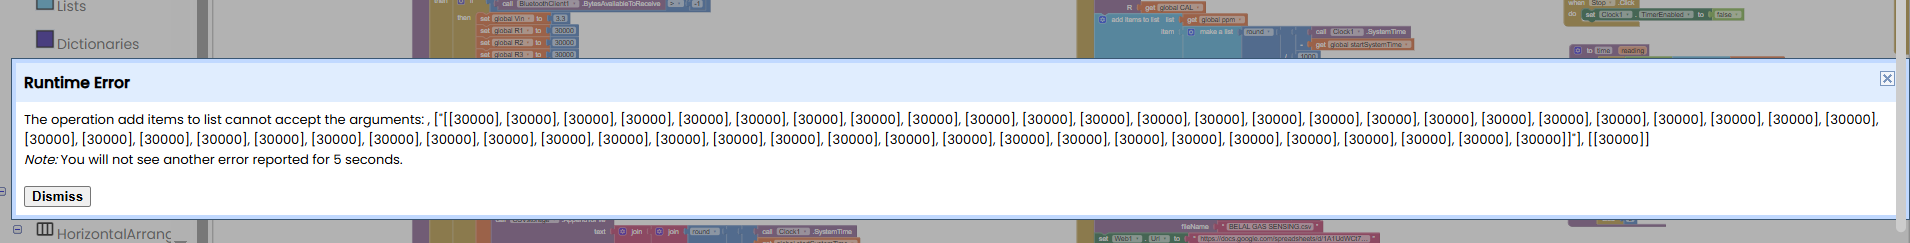
As you see, it can calculate the resistance R4, but it is not showing on the chart, and also V2 is showing in text box V2. Also, the gauge is working, so thank you so much for being kind to teach me and answer my questions.
I have to use something like this example; I will try.
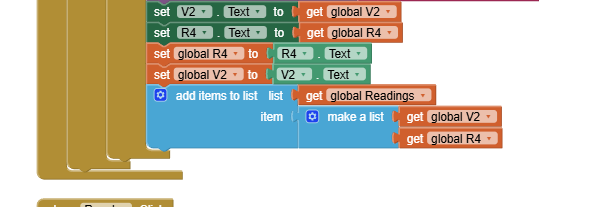
Could you please explain how I can use in my project to store Voltage and R4, and call R4 in char2D?
Actually, it is difficult to show the resistance calculated from voltage on screen 3 on the chart on screen 1, I am trying, but I did not get the solution.
Now I can get the voltage and resistance on screen 3, but still no response on the screen 1 chart.
Thanks, I am trying to find how I can do it, as I still need two things, and I will finish my project. First is plotting R versus time and ppm to rotate the gauge.
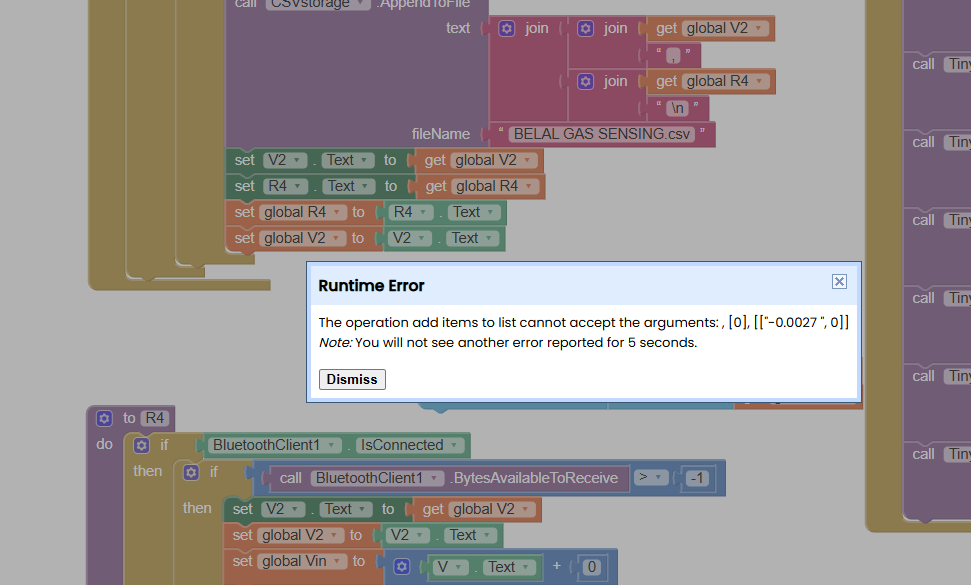
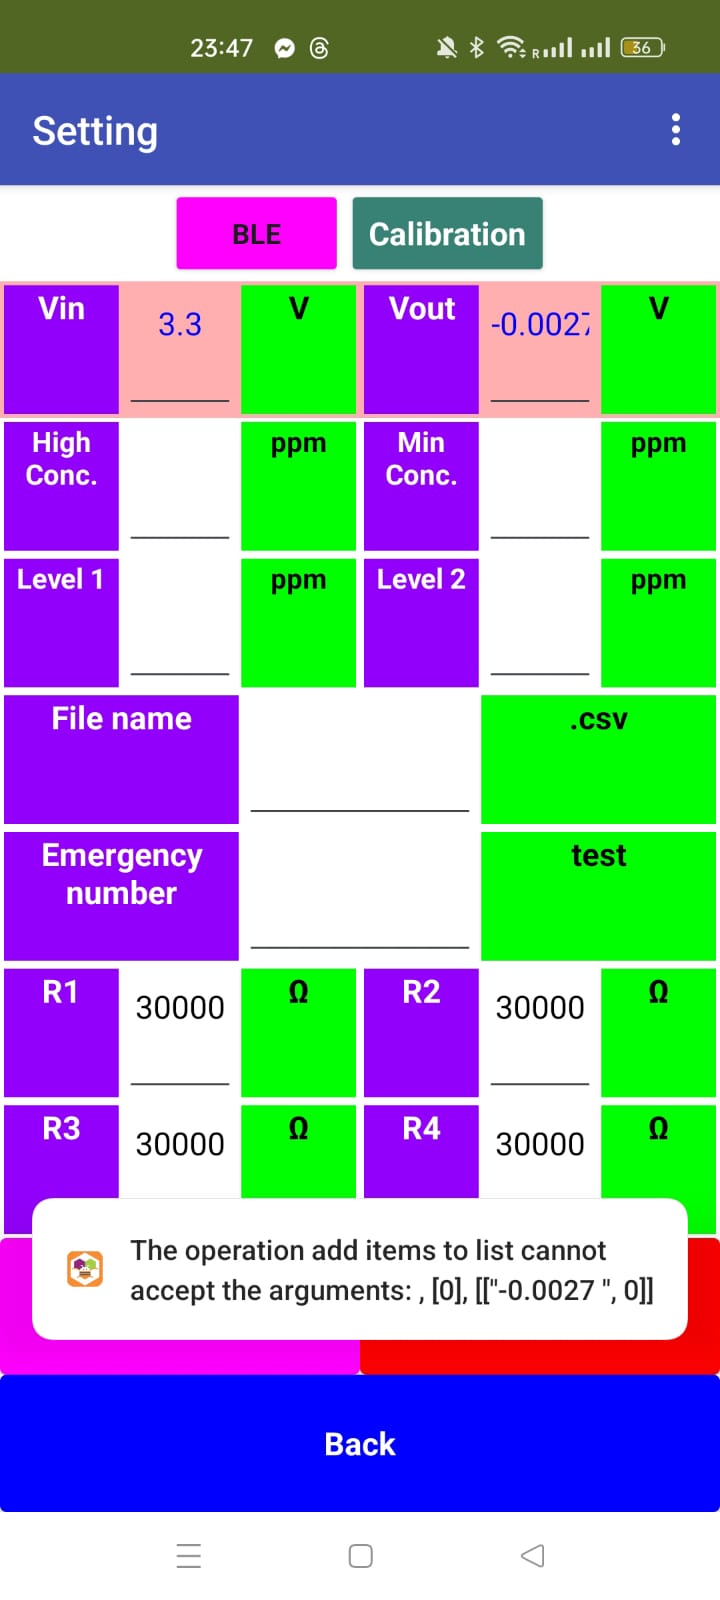
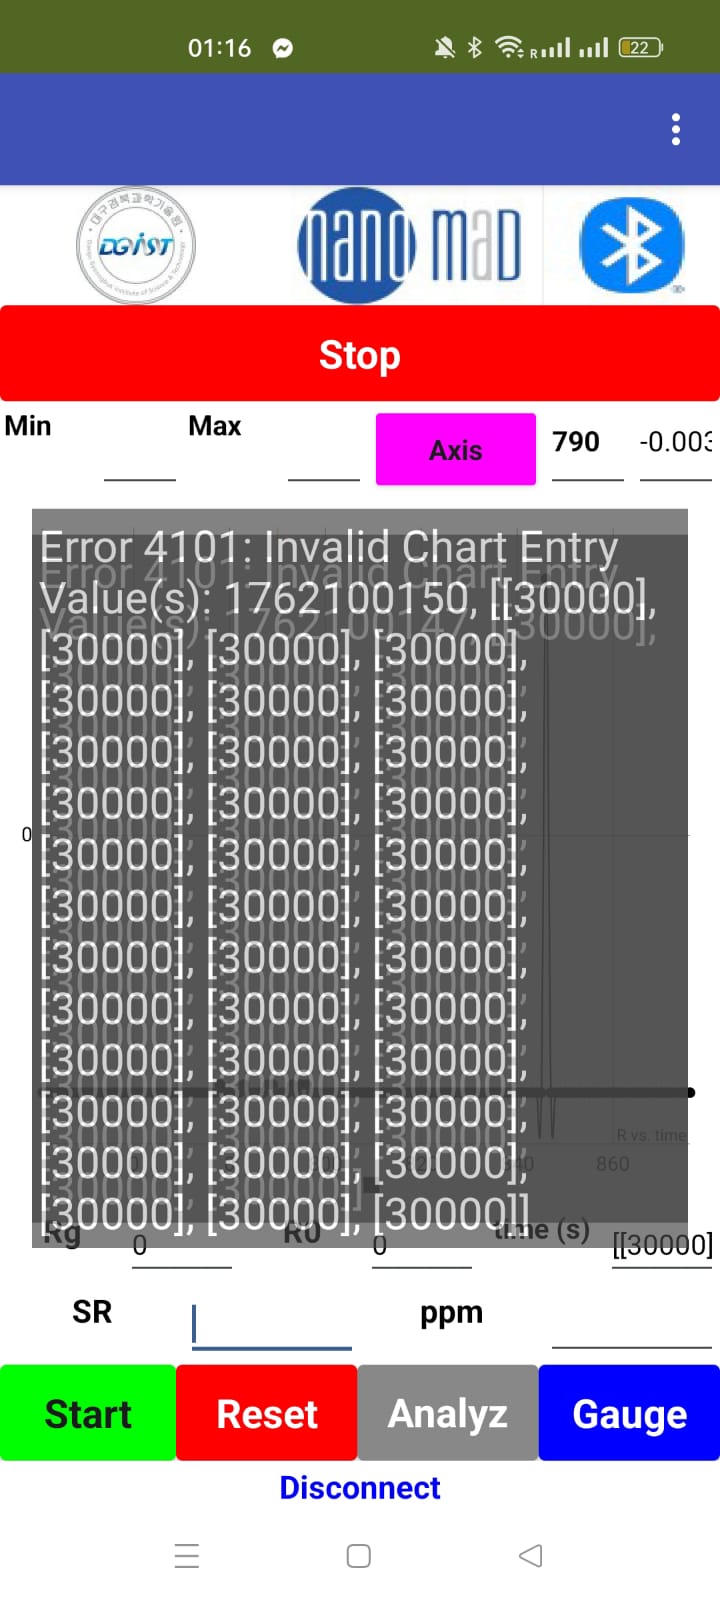
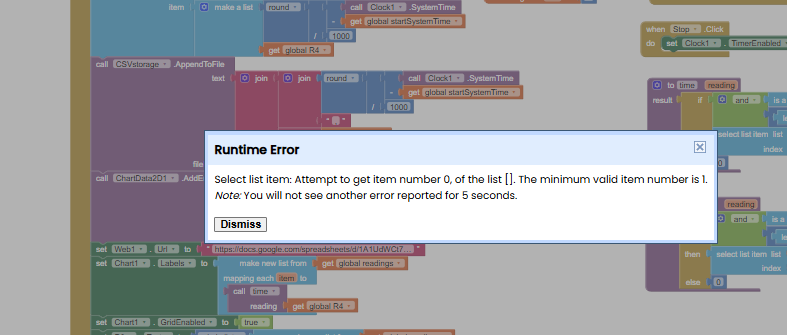
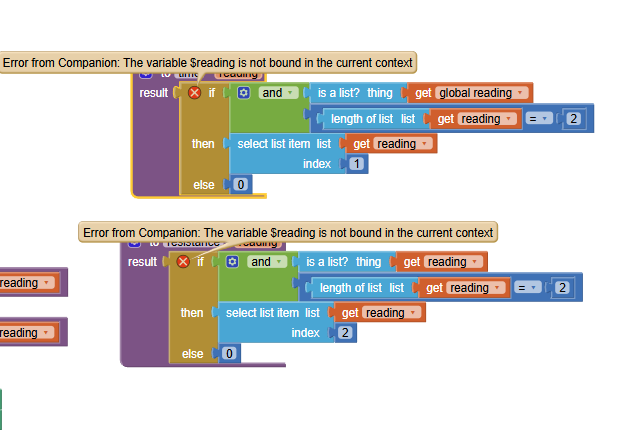
Still, it is giving error
Thanks, the problem now is only in chart entry as now I can call the R4 on Res text box and it is working but on chart not working only reading the volatge values
As an alternative to smoothing the data, pick an incremental value epsilon just bigger than the biggest noise wiggle in R readings, and use that to judge if R is increasing as you sweep through the readings list.