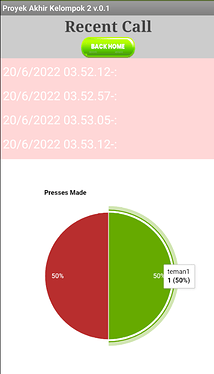
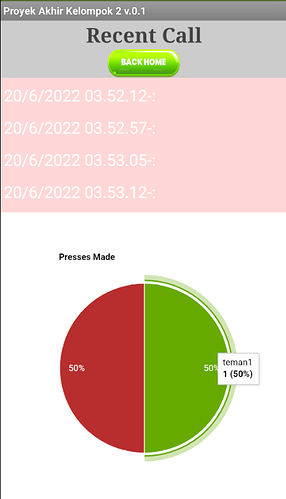
Hello, i am a beginner and i have project that make a shortcut button call, all program is going well and now i want to make a chart from button that user press..
Ex : Button1 = Police, Button2 = Ambulance, Button3 = Postman.
Users are often to press the Police like 5 times, Ambulance 3 times, and Postman 1.
How to make it automatically be a chart? Please help ASAP! Thanks
What type of chart, and with what data? Do you mean a count display of the number of times each button is clicked, for all buttons ?
like pie chart, yesss that was i mean.. can you show me how to do it?
Yeaah it is, how to copy this block into mine? and can i get the extension?
Copy blocks to the backpack
Extension is here:
okay its very helpful, and now if i apply this into my interface, its too crowded by button,etc. Can we make it links into other screen?
Ex: My Button at Screen1, but the Chart can show at other screen like Screen2. Thanks
You can, but I would suggest you use virtual screens - vertical arrangements that you change the visibility on
Call Button Shorcut.aia (2.4 MB)
Can you help me to make the buttonChart into mine? maybe for the 1 button then i will finish it later until it show. I cant make it, the chart didnt show. And can you hide the text of [["service"] at screen? Thanks
Can the chart is last forever? when i closed, it started zero again...
Use TinyDB to hold your variables in separate tags between runs.
Here is a revision of your aia project
Call_Button_Shorcut1_revised_1.aia (258.9 KB)
- Uses virtual screens instead of real screens
- Applies my chartmaker extension ( not the original) and associated blocks
- Data not saved across app starts. You will need to save the data either to your spreadsheet or to tinydb for the data to persist
- If you use your spreadsheet data to build the chart, it must have the same list structure as you see in my example for the pie chart to work properly
Let me know how you get on 
How to add the data of the chart into a database?
Hello, i need solution, how to save the data of the chart that i made. So if the app is closed and we open again, it will be the same chart and continous.
Like mine,
it shows 1, and if i close the app and open again, its still the same and will be continous. Thanks
As I said earlier, you can save the data locally to the tinydb, or save to your spreadsheet, as it appears you are already planning to do. Then ensure that the data recalled from your saved data is consistent with the structure for the chart display.
If you wish, I can do a tinydb example on the revised project I provided....
Okay, can you do it for me? thanks before
Call_Button_Shorcut1_revised_tinydb.aia (259.4 KB)
All data now persistent, using a tinydb on the app.
wow its really work, but why my image is on low quality? how to fix it?
I resized all your images to match the pixel sizing of 130 x 130 in your app, you shouldn't need anything bigger than that on a normal phone....looked OK on my emulator which is twice the size of a phone.
okay thanks for all your help. that solve mine!

