Hi. Im currently new here.
My question maybe easy for expert but can someone teach me how can i create fix chart, and data while pointed at top of chart as im showing below
currently im create some noted for ease myself during works
TQ all
Hi. Im currently new here.
My question maybe easy for expert but can someone teach me how can i create fix chart, and data while pointed at top of chart as im showing below
currently im create some noted for ease myself during works
TQ all
You appear to have done it ?
Is that in Sheets or Excel ?
Make a png of your chart:
I notice your x axis is logarithmic.
That means you will have to massage your incoming x values (x1=10^x) on their way to your plots.
Yes. it from excel. however, im plan to create like this 1 from excel to apps using chart2D. it is possible? since i want to make the x-axis and y-axis are fix value
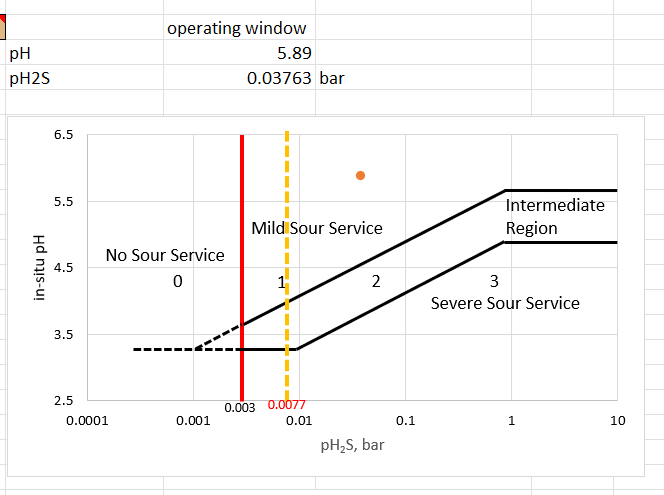
yup sir. your correct. however, i want this x-axis and y-axis are fix. because in the graph there are are was located as dangerous and not dangerous. this graph is originally taken from NACE ISO 15656-2
It would help if you provided all your data for the construction of the graph.
im plan to point my data from top into fixed graph
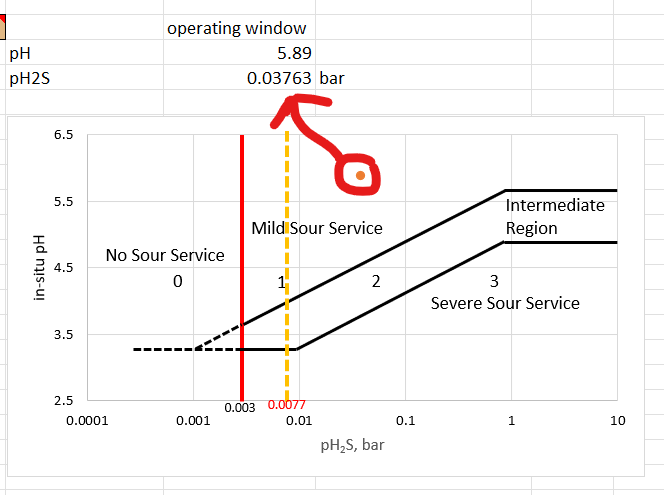
What is this dot ? Do you want the user to press on the graph, for a dot to appear, then report the x/y coordinates/value of the dot ?
Can you give us a link?
the dot is coming from the user key in-data from the pH and pH2S data similar like coordinate with single point. yes. it appear at fixed graph
This might get you started
canvasLineChart.aia (4.3 KB)
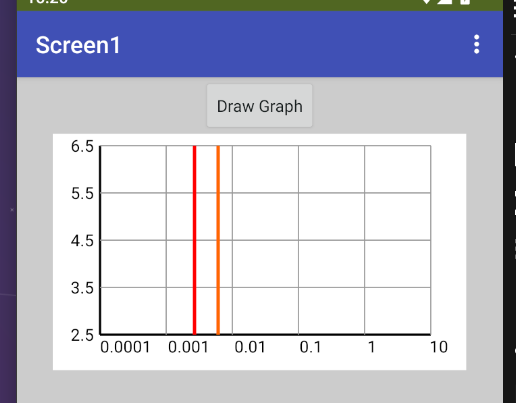
You will need to do some maths to accurately place your red and orange lines and your user data.
0,0 is the top left of the canvas.
It's possible to code a series of if/then/elseif range tests on the two input values to determine the name of the region enclosing that pair.
It would serve the same purpose as the graph.
Vertical and horizontal line boundaries correspond to range limits on the two inputs.
Diagonal lines between two points denote boundaries on the sum (or difference) of one of the inputs and the log (base 10) of the other input.
So to build such a decision tree, start by chopping off rectangular pieces of the graph, until you are left with triangles.
sure noted. thanks for the input. really appreciated
alright will do as your advise. thanks ABG ![]()