avana
January 17, 2021, 9:41am
1
Good day all
I am facing the following issues and would like to seek some kind help please.
I am trying to create an Android App using App Inventor 2 (AI2) that can plot ECG (Electrocardiogram) graphs from 2 BLE (Bluetooth Low Energy) devices concurrently:
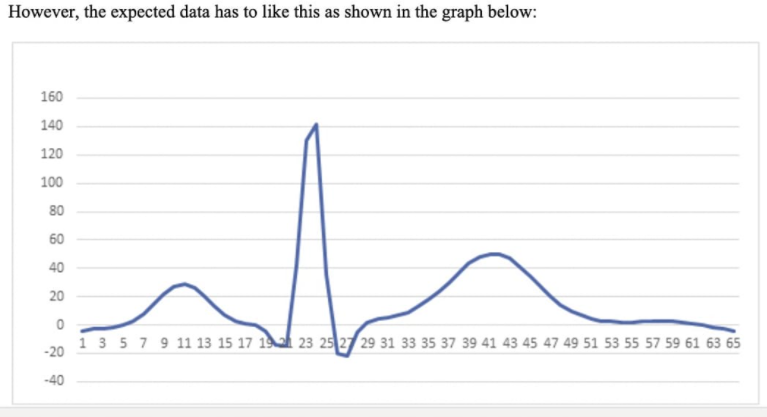
This is how the ECG graph should look like (the data in the BLE devices are fixed):
When scrolled/zoomed in, it should look like this:
However, the Android App that I created using AI2 could only do this:
As such, I am facing the following problems:
Many data points seem to be missing
Can't zoom in/out of the graph
No labels/values for the x-axis and y-axis
Is there anyone who is able to kindly help me with these aforementioned problems please?
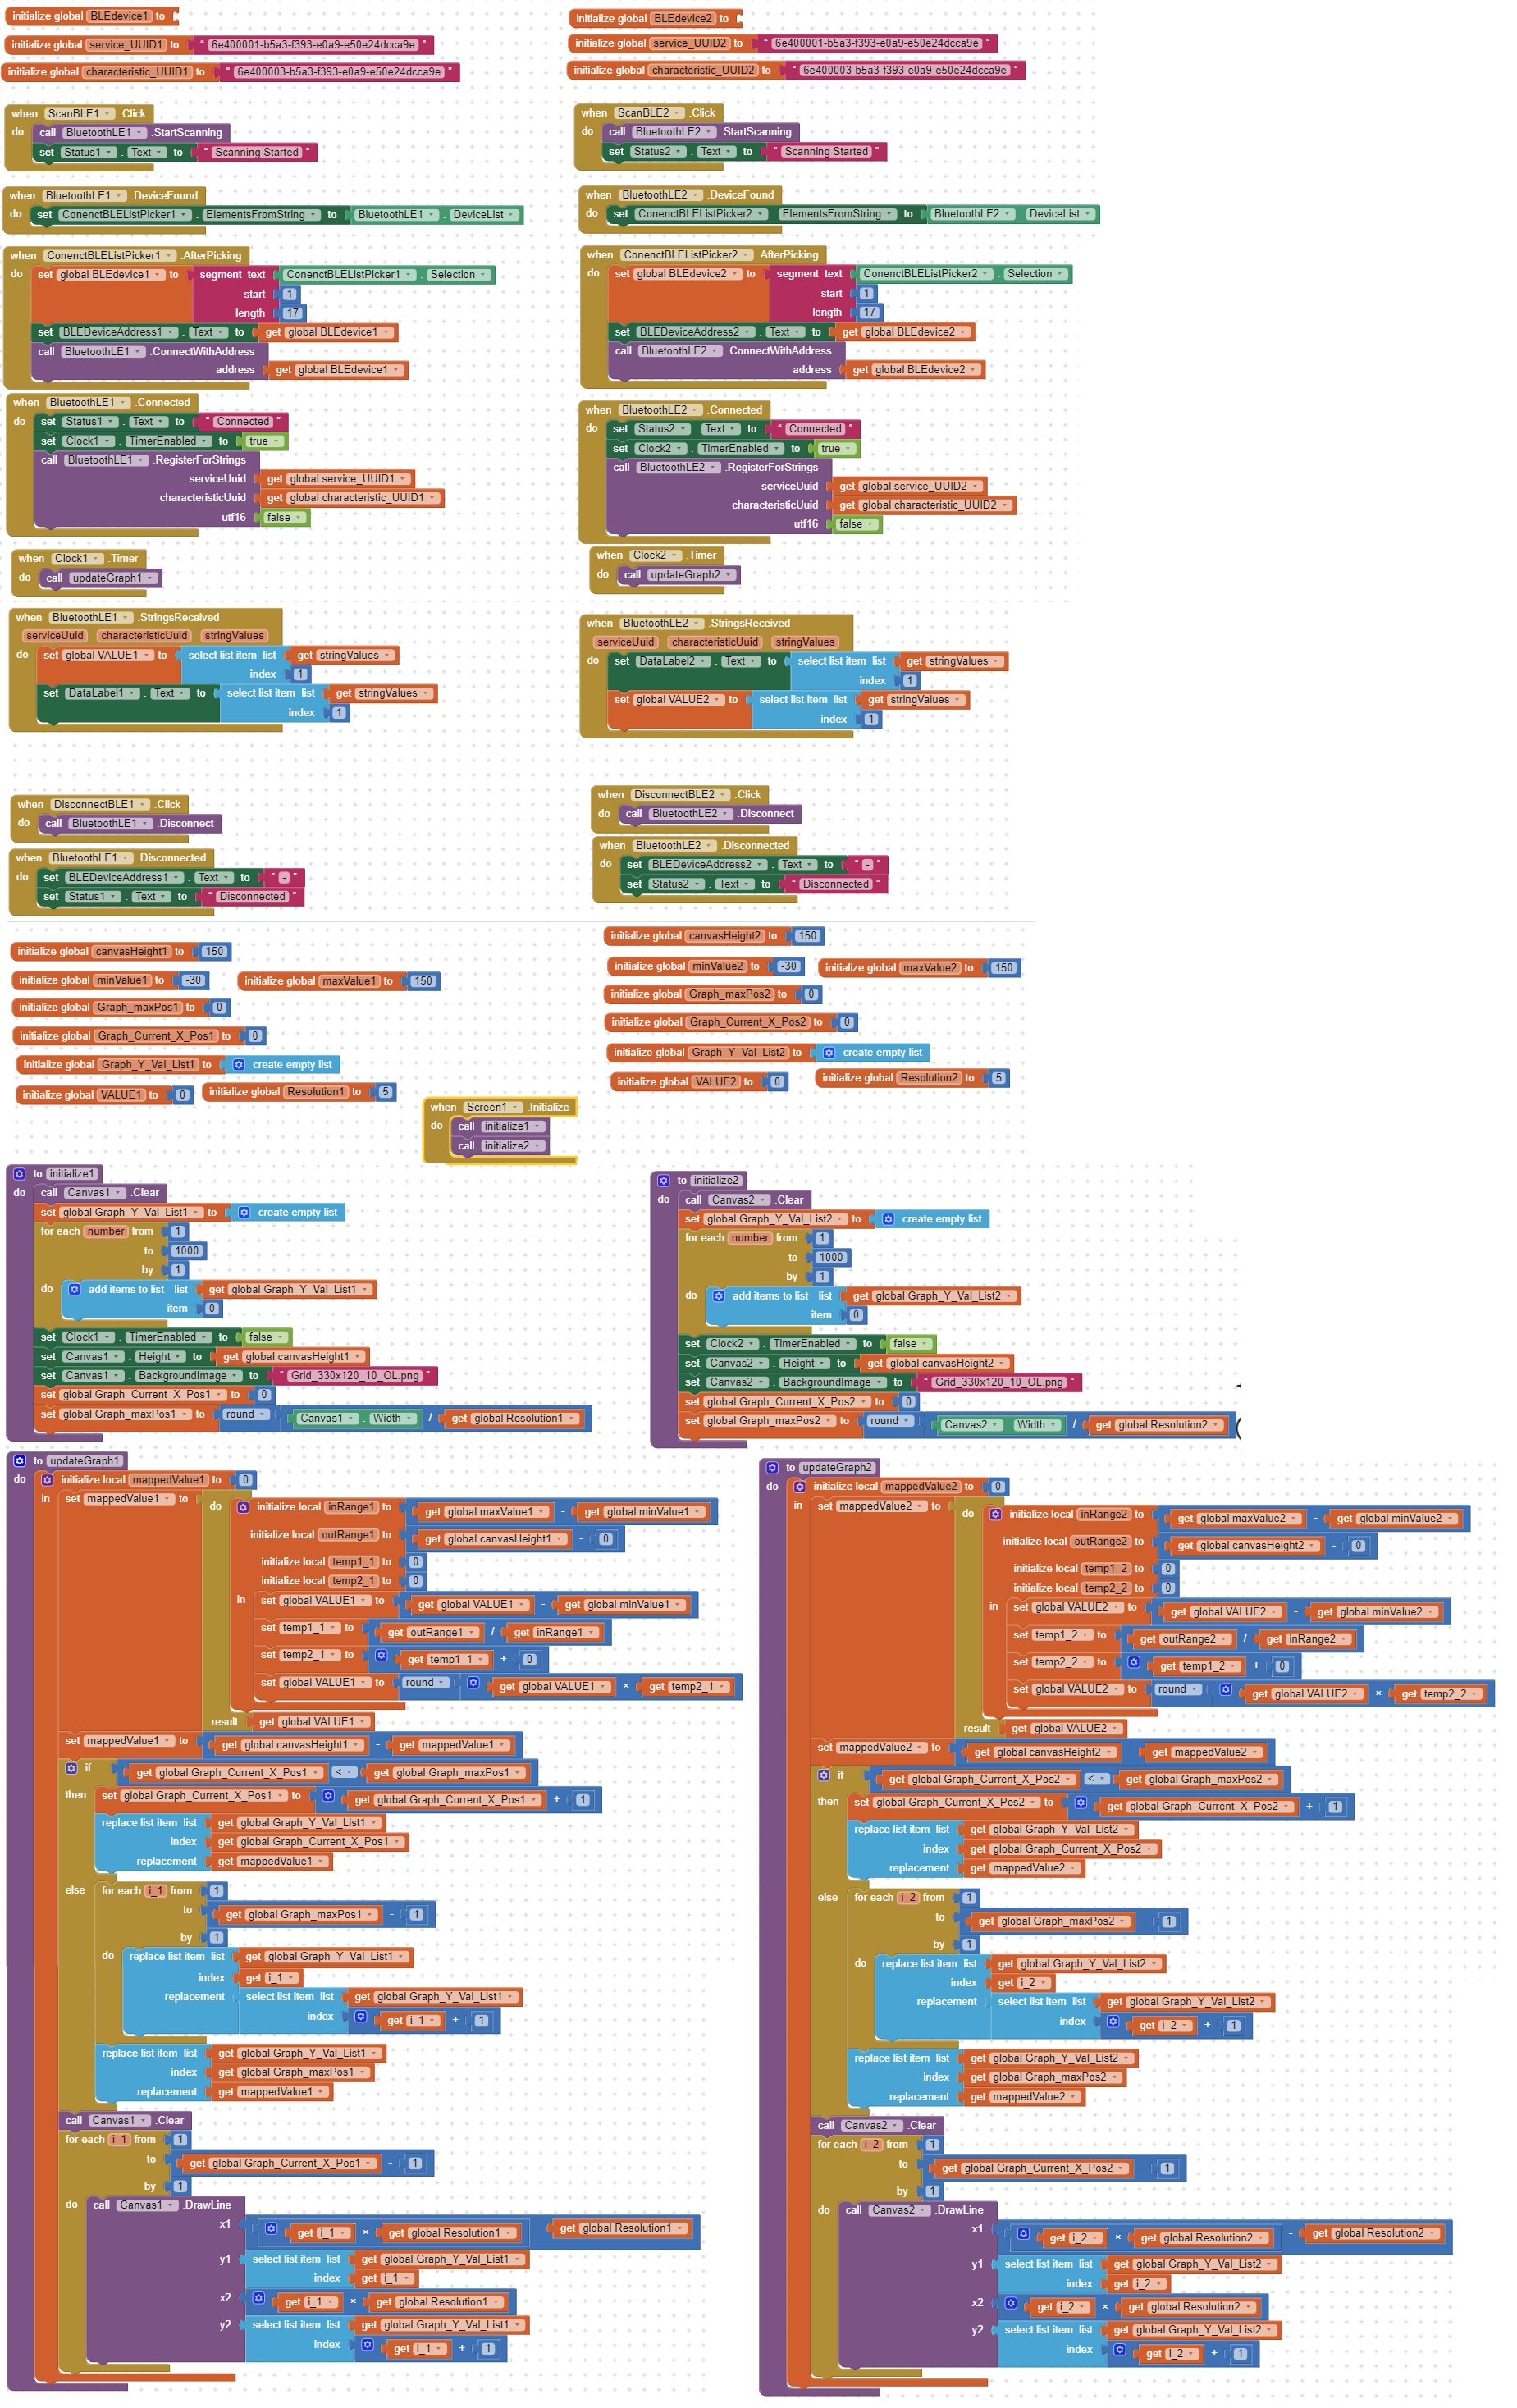
This is the set of code blocks that I used:
This is the aia file for my app:Connect2BLESignals_WithGraphs.aia (218.0 KB)
Appreciate all help and input!
Warm regards,
1 Like
Peter
January 17, 2021, 10:02am
2
Hi,
I am a nurse and also perform ECGs. Are you making this for fun or do you want to use it in a professional setting?
avana
January 17, 2021, 12:12pm
3
Hi Peter,
That's nice!
I'm creating this app as a part of my final year project (FYP).
Warm regards,
1 Like
Peter
January 17, 2021, 12:35pm
4
Are the 2 ble devices especially made for this purpose?
avana
January 17, 2021, 1:22pm
5
Hi Peter,
Yes, they are.
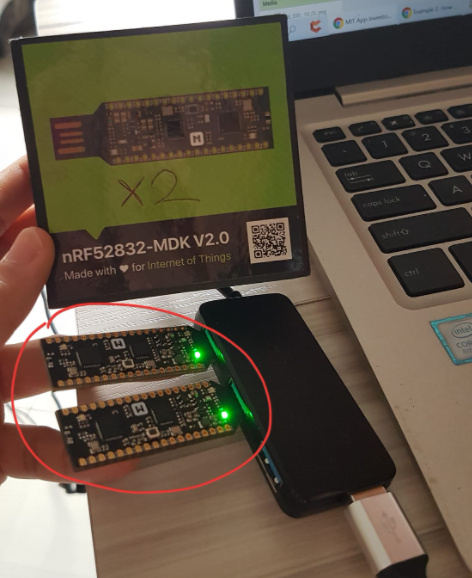
This is the ECG data inside the BLE devices (both devices contain the same data):ecg data.txt (239 Bytes)
This is the info regarding them:info.pdf (210.3 KB)
avana
January 17, 2021, 1:23pm
6
(continued from above)
This is the file saved into the BLE devices:
This is another file (not quite sure what it is for, but it is also in the folder given by my TA with the above 3 files, so I include it here too):
Warm regards,
Will the data be read on the phone in real time? Or do you rather want to load a txt file into the application? How long will your data sample be each time?