Dear All Have a nice day,
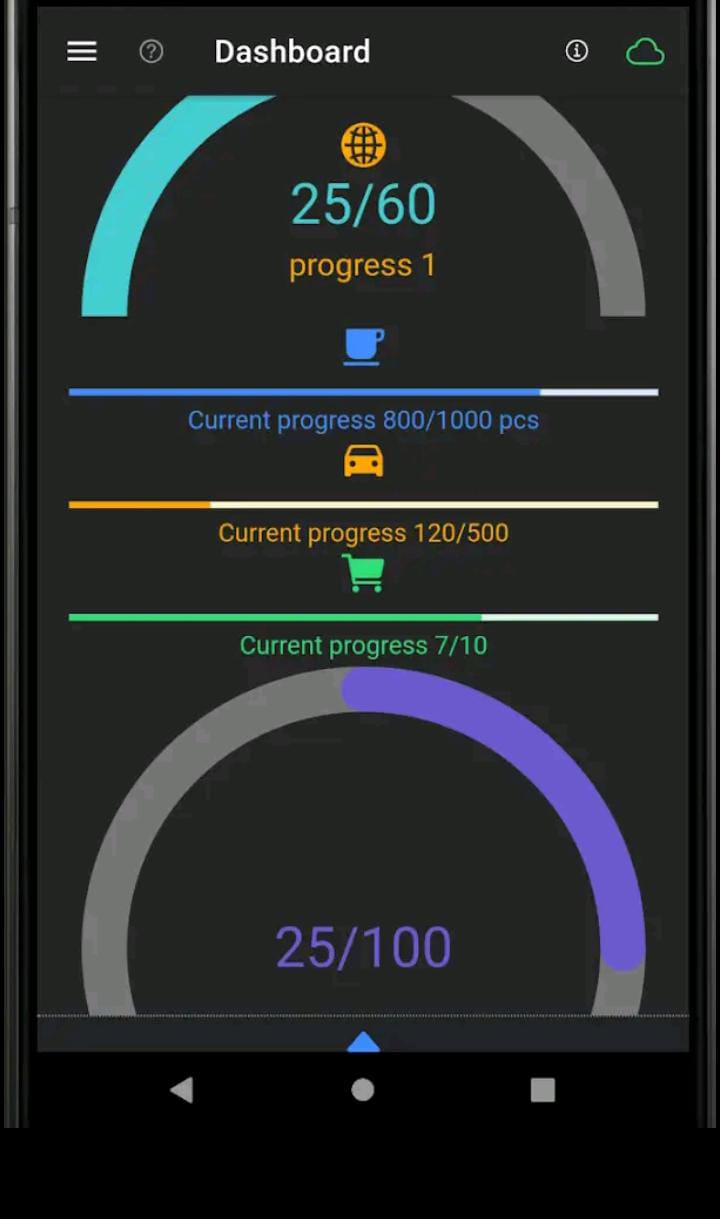
Please see the attached image.....I need update data coming from temperature sensor and humanity sensor that are connected to the IoT device called esp2286
I can manage esp side. The issue is how to create a app interfaces as per the attached image is showing
I mean when the data is coming from the esp how to show in cycle bar as per the attached image is showing
in the first step please advice how to make cycle bar and how to change the cycle bar appalling dummy data instead of data coming from esp
How to set change the progress as per the data coming or using dummy data
In other words real time moving graph
Please advice link the similar tropic
Thanks in advanced