This is my JSON data = [[Sat Sep 02 2023, 110.0, 80.0], [Mon Sep 04 2023, 128.0, 90.0], [Tue Sep 05 2023, 148.0, 82.0], [Thu Sep 07 2023, 140.0, 90.0], [Fri Sep 08 2023, 136.0, 92.0], [Sat Sep 09 2023, 127.0, 85.0], [Mon Sep 11 2023, 134.0, 96.0]] .
How can I plot the stringified json data in charts that I've obtained from google sheets?
What type of chart (line/bar...) ?
There is an issue with your stringified json array. The data export from google sheets is exporting the date as a number, not a string (no double quotes around it)
This: [[Sat Sep 02 2023,110.0,80.0], ...],
needs to become this [["Sat Sep 02 2023",110.0,80.0], ...]
(it is not easy to convert this in AI2)
If you fix this (by converting the date number to a string, or exporting displayValues), then you can use the ChartMakerPlus extension to display your data. You will need to also add a header row.
1 Like
Haa, thanks.
It's a line chart.
Also, the ChartMaker block I got from the extension looks like this:
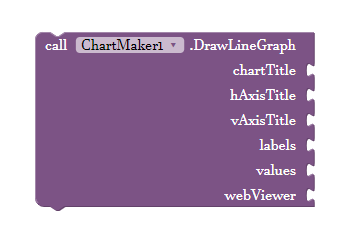
You downloaded the original chartmaker extension, not my ChartMakerPlus extension !
1 Like
Much thanks!
But now I realized that I have to give my data as like this: [{"Date":"Tue Sep 05 2023","Systolic":114,"Diastolic":80},{"Date":"Thu Sep 07 2023","Systolic":118,"Diastolic":77},{"Date":"Fri Sep 08 2023","Systolic":122,"Diastolic":72},{"Date":"Sat Sep 09 2023","Systolic":103,"Diastolic":83},{"Date":"Mon Sep 11 2023","Systolic":125,"Diastolic":75},{"Date":"Wed Sep 13 2023","Systolic":120,"Diastolic":70},{"Date":"Fri Sep 15 2023","Systolic":118,"Diastolic":84}]
Also, I'm getting this data from google sheets via apps script. So, could you tell how I can upload (not the data directly, but the URL of apps script) it in mit using web component ?
Please show layout of data in Google sheets, and your Google apps script.
And I just want to plot the columns 2,3 & 4 only.
With your spreadsheet as "anyone with the link", you can use gviz query, no need for an apps script:
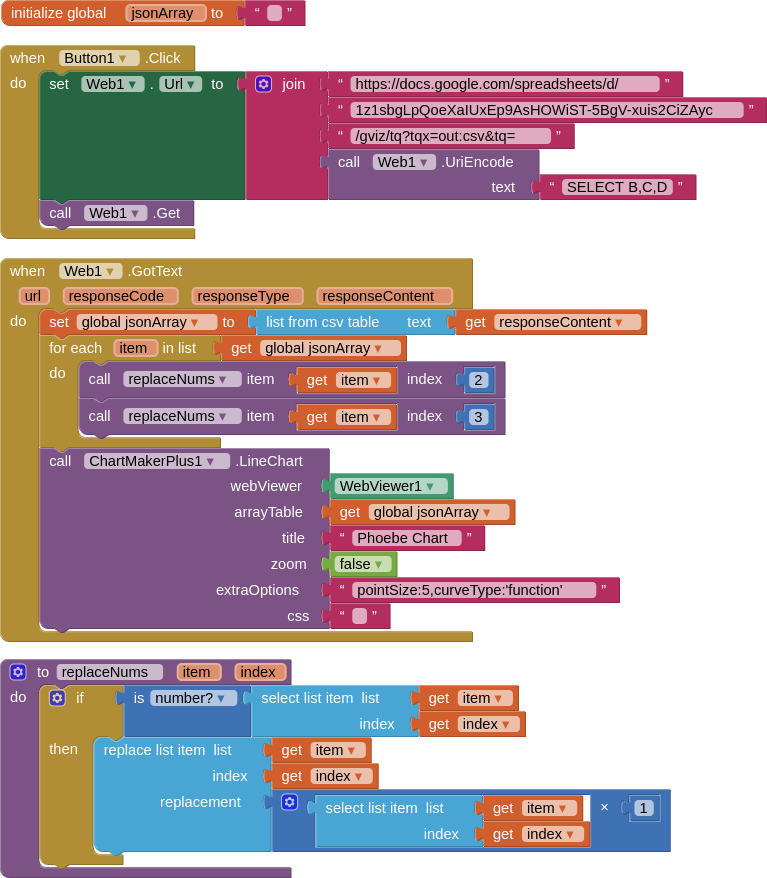
the query returns the numbers as strings, so these need replacing. There is probably a better all round procedure for doing that!
That's a good suggestion. Thank you very much.
But I get these values input through the app and I use google script to run this..
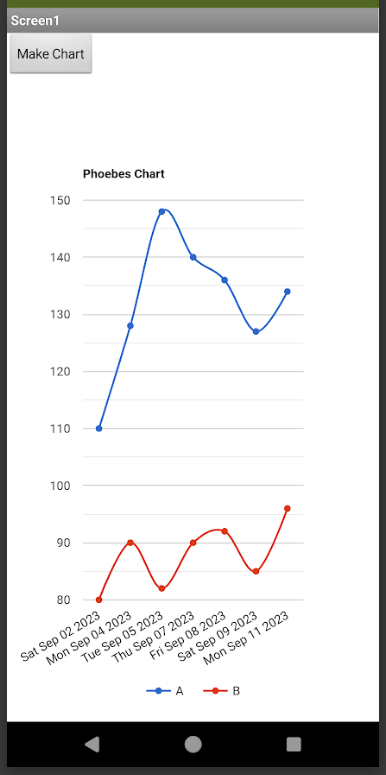
Also, my app layout is required to be as in the image below:
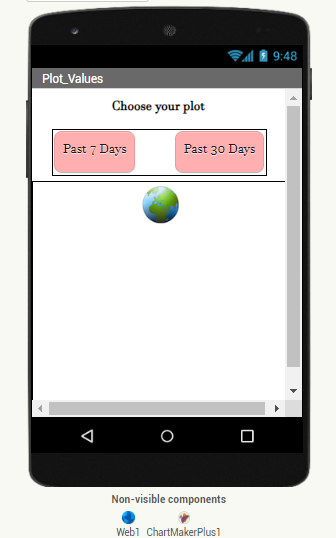
Here, I have to plot the last 7 or 30 days data of the user as desired, and as updated. So, do you have a better suggestion for this?
You can run a query with a condition for the dates
While testing, for some reason, three records in the data are returning empty, rows 3,12,17....
In the meantime I will work up a google apps script to return last 7 & 30 days.....
1 Like
Here is a working google apps script for returning either 7 days or 30 days. I had to adjust the dates by one day as they were coming through in the script as the day before (even though both my timezones are the same?). I used a script bound to the spreadsheet.
function doGet(e) {
  var ss = SpreadsheetApp.getActive();
  var sh = ss.getSheetByName('Sheet1');
  var data = sh.getDataRange().getDisplayValues();
  var arr = [];
  var now = new Date();
  var year = now.getFullYear();
  var month = now.getMonth();
  var first = now.getDate() - now.getDay() + 1;
  var lastWeek = new Date(year, month, first - 7).getTime();
  var lastMonth = new Date(year, month, first - 30).getTime();
  var history;
  if (e.parameter.history == 7) {
  history = lastWeek;
  } else {
    history = lastMonth;
  }
  for (var i=1;i<data.length;i++) {
    var firstDate = Date.parse(data[i][1]);
    var secondDate = new Date(firstDate + 24 * 60 * 60 * 1000);
    if (secondDate > history) {
     var fDate = Utilities.formatDate(secondDate, "GMT", "yyyy-MM-dd");
     arr.push([fDate,parseInt(data[i][2]),parseInt(data[i][3])]);
    }
  }
  arr.unshift([data[0][1],data[0][2],data[0][3]]);

  return ContentService.createTextOutput(JSON.stringify(arr));
}
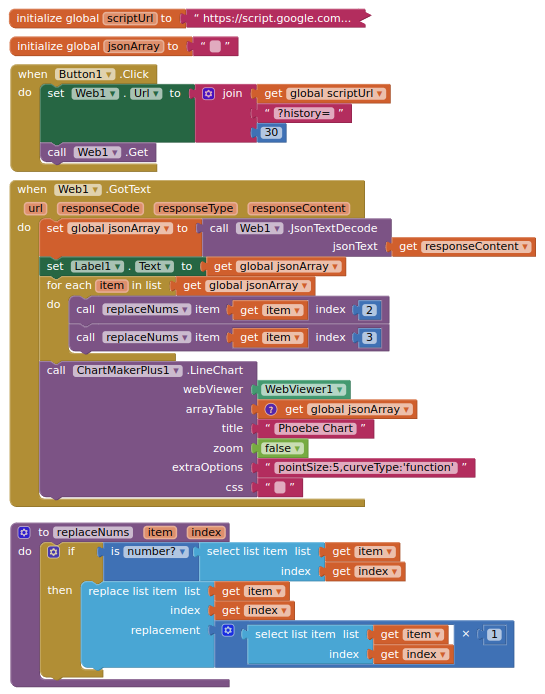
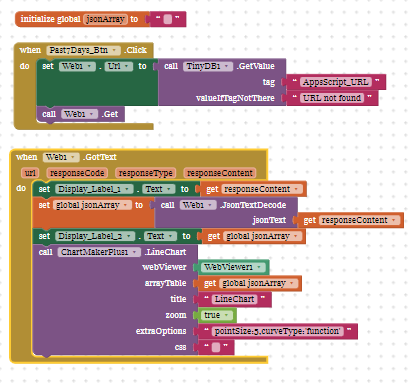
Blocks:
1 Like
Put the output of this
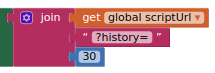
should look something like:
https://script.google.com/macros/s/AKfycby-111119uHuBe0_DVUKfv-EQLM1i1BbioCsUgPyK8Ih0aCh6ZD-uUweNi37TLiqt6zRg/exec?history=30
into your computer browser, what do you get back ?
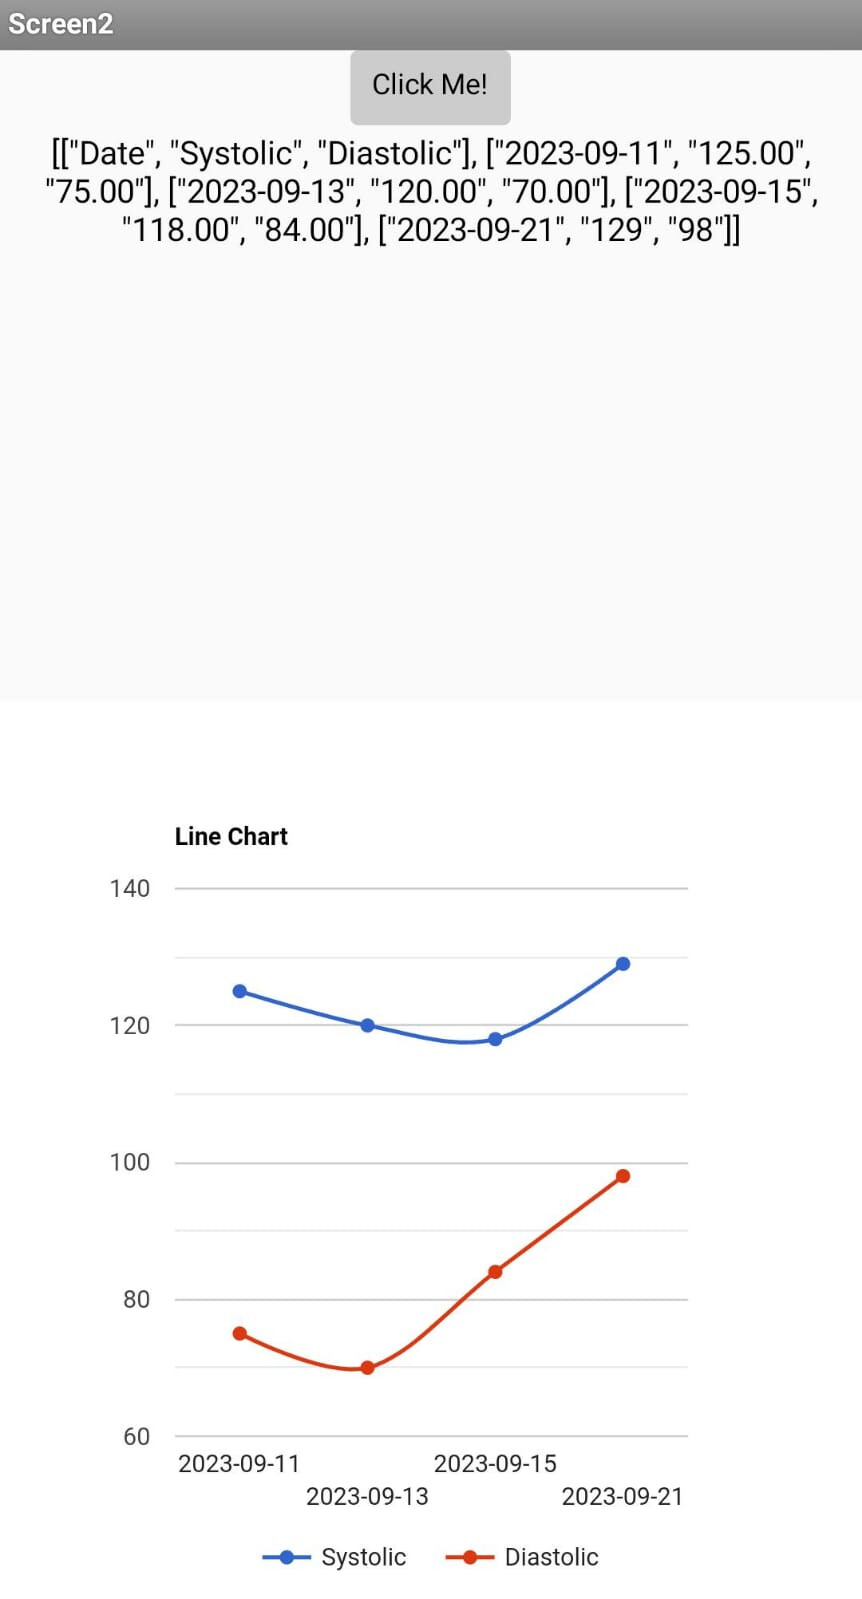
[["Date","Systolic","Diastolic"],["2023-08-21","118.00","78.00"],["2023-08-22","108.00","78.00"],["2023-08-23","126.00","80.00"],["2023-08-24","120.00","78.00"],["2023-08-25","118.00","80.00"],["2023-08-28","108.00","70.00"],["2023-08-29","120.00","80.00"],["2023-08-30","132.00","82.00"],["2023-08-31","122.00","80.00"],["2023-09-01","116.00","68.00"],["2023-09-02","118.00","84.00"],["2023-09-04","122.00","78.00"],["2023-09-05","114.00","80.00"],["2023-09-07","118.00","77.00"],["2023-09-08","122.00","72.00"],["2023-09-09","103.00","83.00"],["2023-09-11","125.00","75.00"],["2023-09-13","120.00","70.00"],["2023-09-15","118.00","84.00"],["2023-09-21","129","98"]]
I'm getting this.
And I tried again and am getting the plot. The plot includes all the 20 entries tho. How can I get the plot of 7 entries ?
Change 30 to 7
@TIMAI2 Thank you for your help so far.
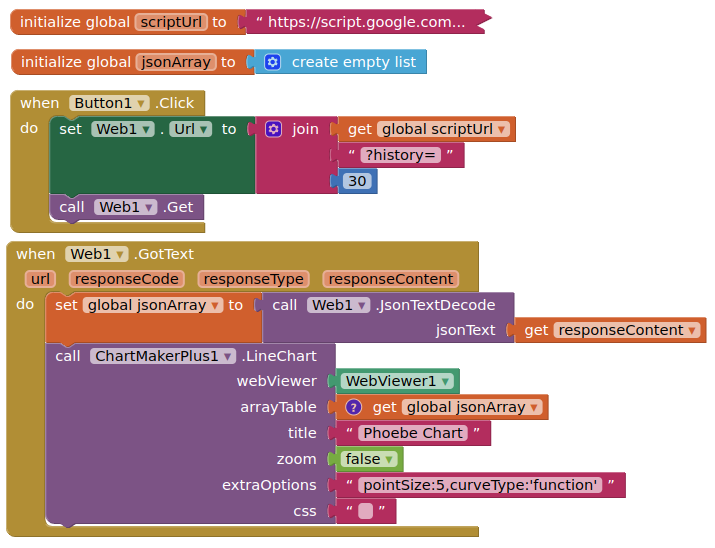
I have tried to modify the code in my apps script and have obtained the response content (in Label 1) as like:
"[["Thu Sep 07 2023",118,77],["Fri Sep 08 2023",122,72],["Sat Sep 09 2023",103,83],["Mon Sep 11 2023",125,75],["Wed Sep 13 2023",120,70],["Fri Sep 15 2023",118,84],["Thu Sep 21 2023",129,98]]"
and my decoded jsonArray (in Label 2) as like:
[["Thu Sep 07 2023",118,77],["Fri Sep 08 2023",122,72],["Sat Sep 09 2023",103,83],["Mon Sep 11 2023",125,75],["Wed Sep 13 2023",120,70],["Fri Sep 15 2023",118,84],["Thu Sep 21 2023",129,98]]
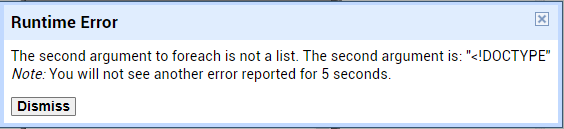
Now, I just need help to segregate the data and plot in chartmaker. It says I can’t use a list. So pls can you look into it?
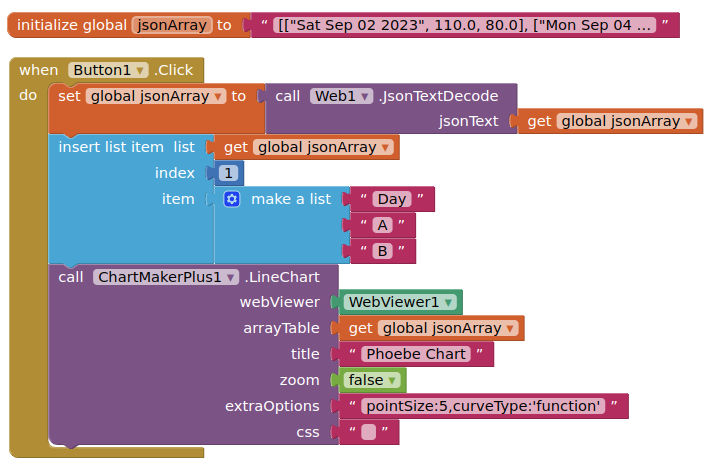
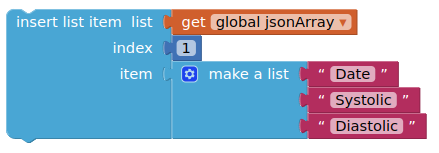
You do not have a header row.
Either, include this in your script (it is already in my script):
arr.unshift([data[0][1],data[0][2],data[0][3]]);
or insert it to the list before displaying the chart:
I have also made a small edit to the script to convert number strings to integers (see above), which means the little procedure I used is no longer necessary.
1 Like
It says that my global jsonArray is a 'string' and not a 'list' ![]()
![]()
Also I have used the '.unshift' function. I love it, Thanks!