How can I plot Date vs Value line chart which is coming from google spreadsheet

Here is an example, using the Chartmakerplus extension:

The values in global linedata represent what is likely to be returned from the google sheet, and assumes that the dates are strings and not numbers

2 Likes

Thanks @TIMAI2 , It is working with your data but when I am trying to plot chart by google sheet data it is showing error

.

1 Like

code is there.

1 Like

Yes, you have fallen into the AI2 event processing trap! All your procedures in the initialise event will run at the same time, so you won't get you data because it is not there....

Let me do some blocks for you....
blocks (20)


  • Get the data from the spreadsheet
  • then create the new list with items 1 and 3 from each row, keeping the first row as titles (text)
  • while doing this convert item 3 to a number by multiplying by 1
  • set the list to the chart
2 Likes

Now Its working. Thanks @TIMAI2.

@TIMAI2 can we make chart like thisref

Yes. You will need to add that option in the options section of the chartmakerplus block.

See the link for line chart in the chartmakerplus post for the options that are available

Chartmakerplus extension

Thanks @TIMAI2 , when I switch the layout then it is repeating graph on screen again and again. like this


and when app opens then
Please Help me!

I thought you might ... Set both lists to create empty list at the beginning of the web1 gottext block

see this

image

1 Like

Now It's working perfectly. Thanks @TIMAI2.

@TIMAI2, how to label the day and week's name with time on hAxis.
instead of "11/10/2021" label "11 mon, 10:34:54".
In My google sheet, I also have time column.

Using date "numbers" can be a bit confusing, but you should be able to get it to work.

This was already raised in the Chartmakerplus extension topic:

I'm not able to find any thing which is satisfying my condition.
I tried hAxis.format but it not worked.
see csvfile : WaterMonitoringSystem.pdf (25.4 KB)
Can we use the date column element in new date() function and put into the list variable and after that it will give week name and day??

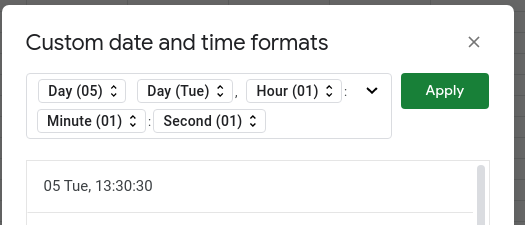
I formatted the date/time number to 24 Sun 11:45:36 format.
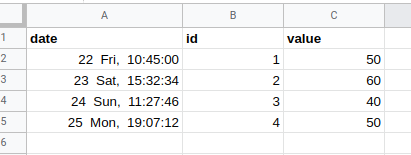
Date/Time was typed in like this to the cells: 24/10/2021 11:45:36

image

image

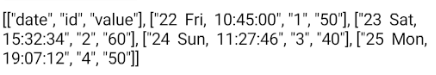
calling down the data returns a list converted from csv table as

image

producing this chart

image

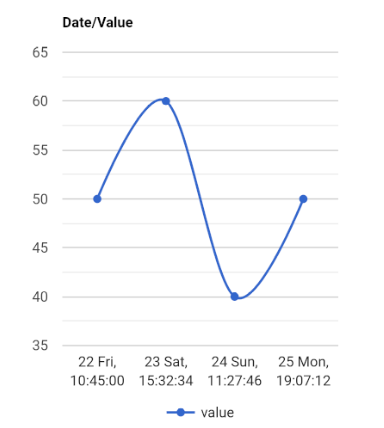
is this what you want ?

Yes this is perfect.
But,I am using apps script for data entry in sheet.
so I can not change data format manually.

then use apps script to do it

setNumberFormat

https://developers.google.com/sheets/api/guides/formats


see this!

This topic was automatically closed 7 days after the last reply. New replies are no longer allowed.