I tried the Date format for the Charts X axis.
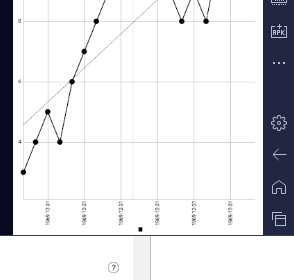
The ValueFormat tool tip is unhelpful regarding the Date format.
It might be interpreting my integers 1-20 as milliseconds in 1970 , but I can't make out the date front part.
I tried the Date format for the Charts X axis.

The ValueFormat tool tip is unhelpful regarding the Date format.
It might be interpreting my integers 1-20 as milliseconds in 1970 , but I can't make out the date front part.
I'm wondering too. For the height I removed it, for the width I had to skip it.
Sometimes copies repetitive parts of code from other components to save time, but forget to change the details. Large text on the monitor actually helps, good eye.
Switching Projects from within the Blocks Editor sends me into an empty Blocks Workspace on the other project, devoid of blocks and controls, until I switch in and out of the Designer.
Also, I suspected my trackball, but it looks like something is eating my first click on a Project in the Projects list.
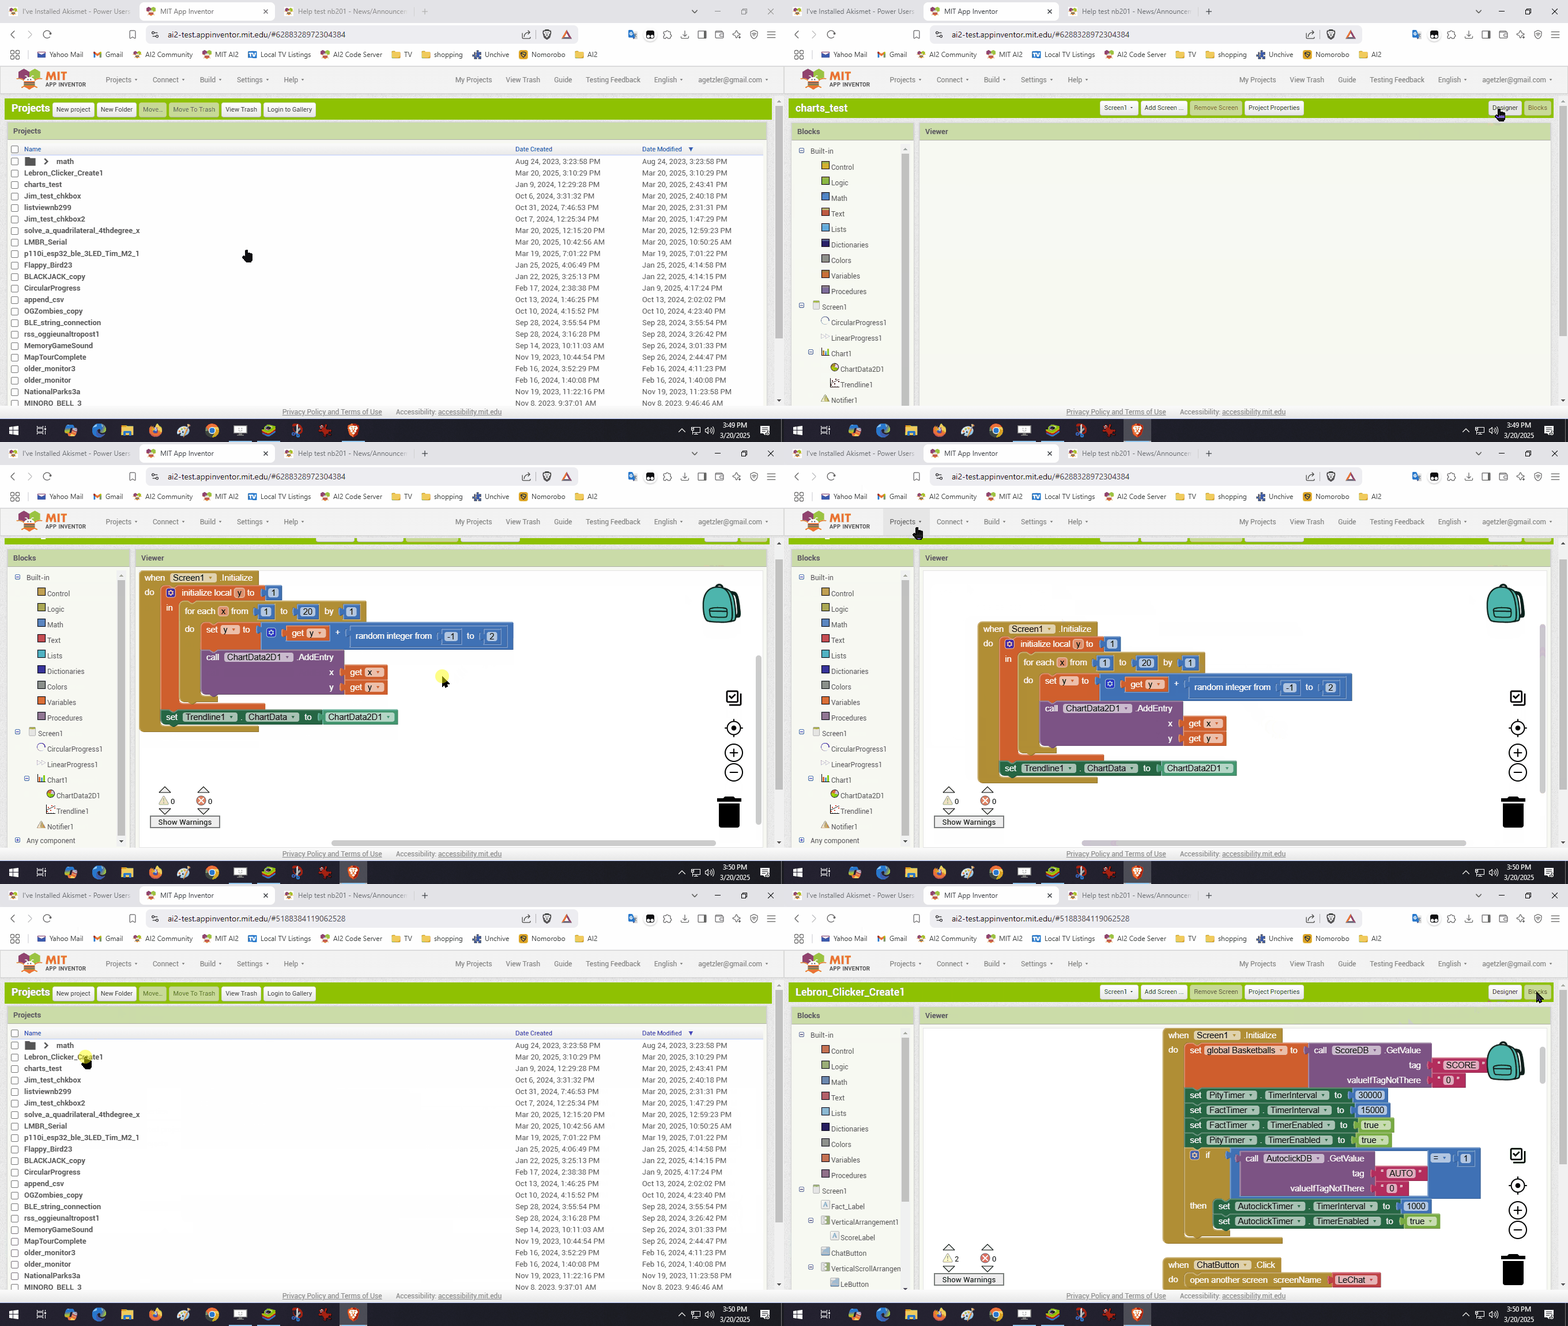
Not able (still...) to drag and drop files to Media on Chrome on Linux
Dragging block/s to right of blocks editor does not scroll to right, even if there are other blocks off screen to the right.
Not able to drag multiple blocks after selecting when only clicking/setting the blockly checkbox. Works if SHIFT is pressed (which sets the blockly checkbox...)
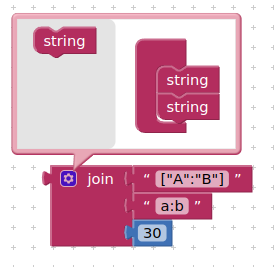
Creating a new socket on the join block by dragging a block to it, creates the socket, but does not update the blocks comment (if you have it open at the time)
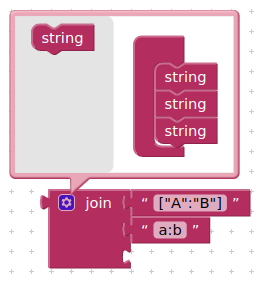
but then drag a block to add a new socket further up, the bottom socket is removed
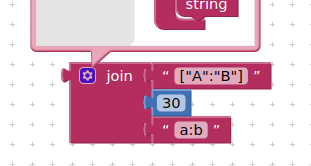
What I need examples of:
Yes, this tool is not presently well documented in Help or the yellow help.
My comments may help someone. I tried various other servers that had custom tiles with mixed results. Using this is complex.
For some of the examples I tried I was not able to get any results using the test Companion (I had to Compile the code to see the tiles)..
Here is the example that worked ![]()
The example shown is not a worldwide example tile set. ![]()
Below are all my Blocks. Evidently you have to declare CustomURL in Screen.Initialize. I tried using a Button and the tool would not work..
Regards,
Steve
I encountered a problem, when I add a label inside the absolute arrangement, AI2 gives an error and in App Inventor too and when I try to open an already downloaded application, it does not open, it just stays on a gray screen.
Yes we have a fix for this and will be in the next ai2-test update.
Did you also set the map type to Custom in the designer? If so, then that sounds like a bug.
This is the link MIT provided
https://example.com/geoserver/gwc/service/tms/1.0.0/workspace:layername&64;EPSG:3857@jpeg/{z}/{x}/{y}.jpeg?flipY=true&authkey=123
the code /{y}.jpeg?flipY=true&authkey=123 seems either my mistake or a documenting error.
I copied the link manually from the tooltip. I did not use the Advanced url box (it was hidden there ) ![]()
and it appears either the tooltip is in error or I did not copy it manually correct.
It shouldn't matter where the url is posted using Blocks or the Designer. The documentation didn't say where it went. So it is supposed to be loaded in the Designer?
Perhaps one of the young guys you work with can figure this out. Thanks. ![]()
In the new version of ai2-test you can test new properties and events in the Slider component. The slider now has high accuracy, we can set the thumb color, and thanks to new events we can detect the moments of start and end of user interaction with the slider.
The first just affects App Inventor developers (not users) who build App Inventor on Windows. There was an issue with how Google Closure Compiler expands globs (paths like **/*.js) on Windows compared to Unix-like OSs like macOS and Linux that caused the Javascript that runs App Inventor to not compile correctly.
The second is also a build specific thing where we have a flag we can add to the build (-Dlocal.services=true) that will allow running App Inventor as a single page webapp but without the need for a backend server by doing all of the storage in memory. This is still a work in progress but we want to make sure it doesn't diverge too much from the mainline version.
For custom map URLs (also @SteveJG): running a map server is expensive so I don't want to broadly advertise someone's existing service, but here's an example project that uses OpenSeaMap to load seafaring markers. Note that the tile server in question is just an overlay tile server so you won't see the base layer, but I pointed it near the English Channel so you can see some of the map markings. MapUrlTest.aia (1.4 KB)
Great, one can set the number of steps ![]()
Yes, thanks to this we can set the max to e.g. 100, the number of steps to 1000 and we have a slider that returns values every 0.1.
The slider should also no longer reset its position when changing max or min.
Technically one can go the other way as well though, right? Susan was working with you on it but my understanding is you could do something like a rating system as well with min = 1, max = 5, and step = 5 to get "coarse" steps whereas the old implementation would still allow for values like 1.05.
Then we will get fractions. If we want integer values, we need to set the number of steps to 4. We can also get the same as in the old implementation by setting the number of steps to 100.
There's something wrong with the math then, a scale of 1-5 has 5 steps (1, 2, 3, 4, 5).
From 1 to 2 - first step
From 2 to 3 - second step
From 3 to 4 - third step
From 4 to 5 - fourth step
5 points but 4 steps. If we wanted to count this first point too, we would have to implement subtraction of this one point.
Today I will think it over, improve it and add a new PR if it is supposed to look like this.