I now do not know what you want to color. It seems you got part of it. 
Did you know there is an interactive tool at Visualization: Gauge | Charts | Google for Developers
You can use the Code it your self on JSFiddle button and then change values on the page that displays (in the black field ..right on the screen. Then use the Run button at the top of the form next to the blue cloud to see the results displayed.
You might try minorTicks: 5,
and for the colors, I am not sure. Do you want different color zones on the x,y and z accelerations? In that case, you may need a different html file for each acceleration showing the ranges you desire and a separate url for each WebViewer.
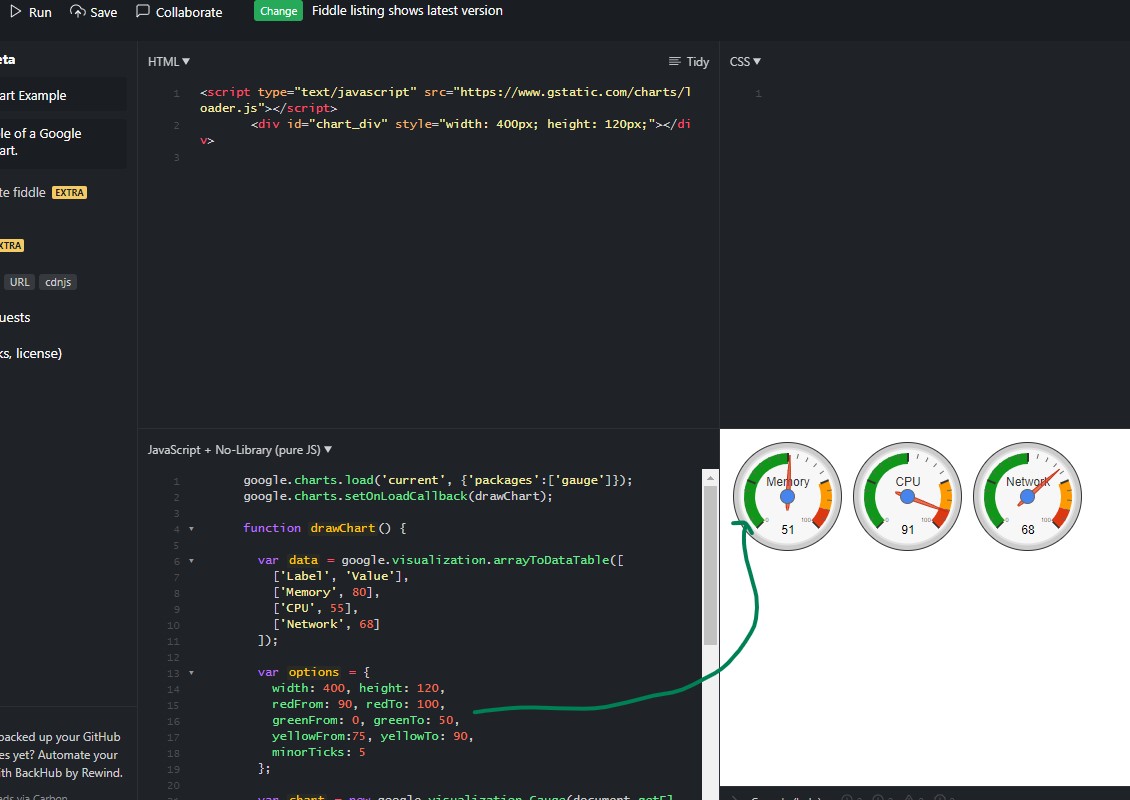
or use different colors like I did here adding green.