Graph does not appear(chartmaker plus extension)

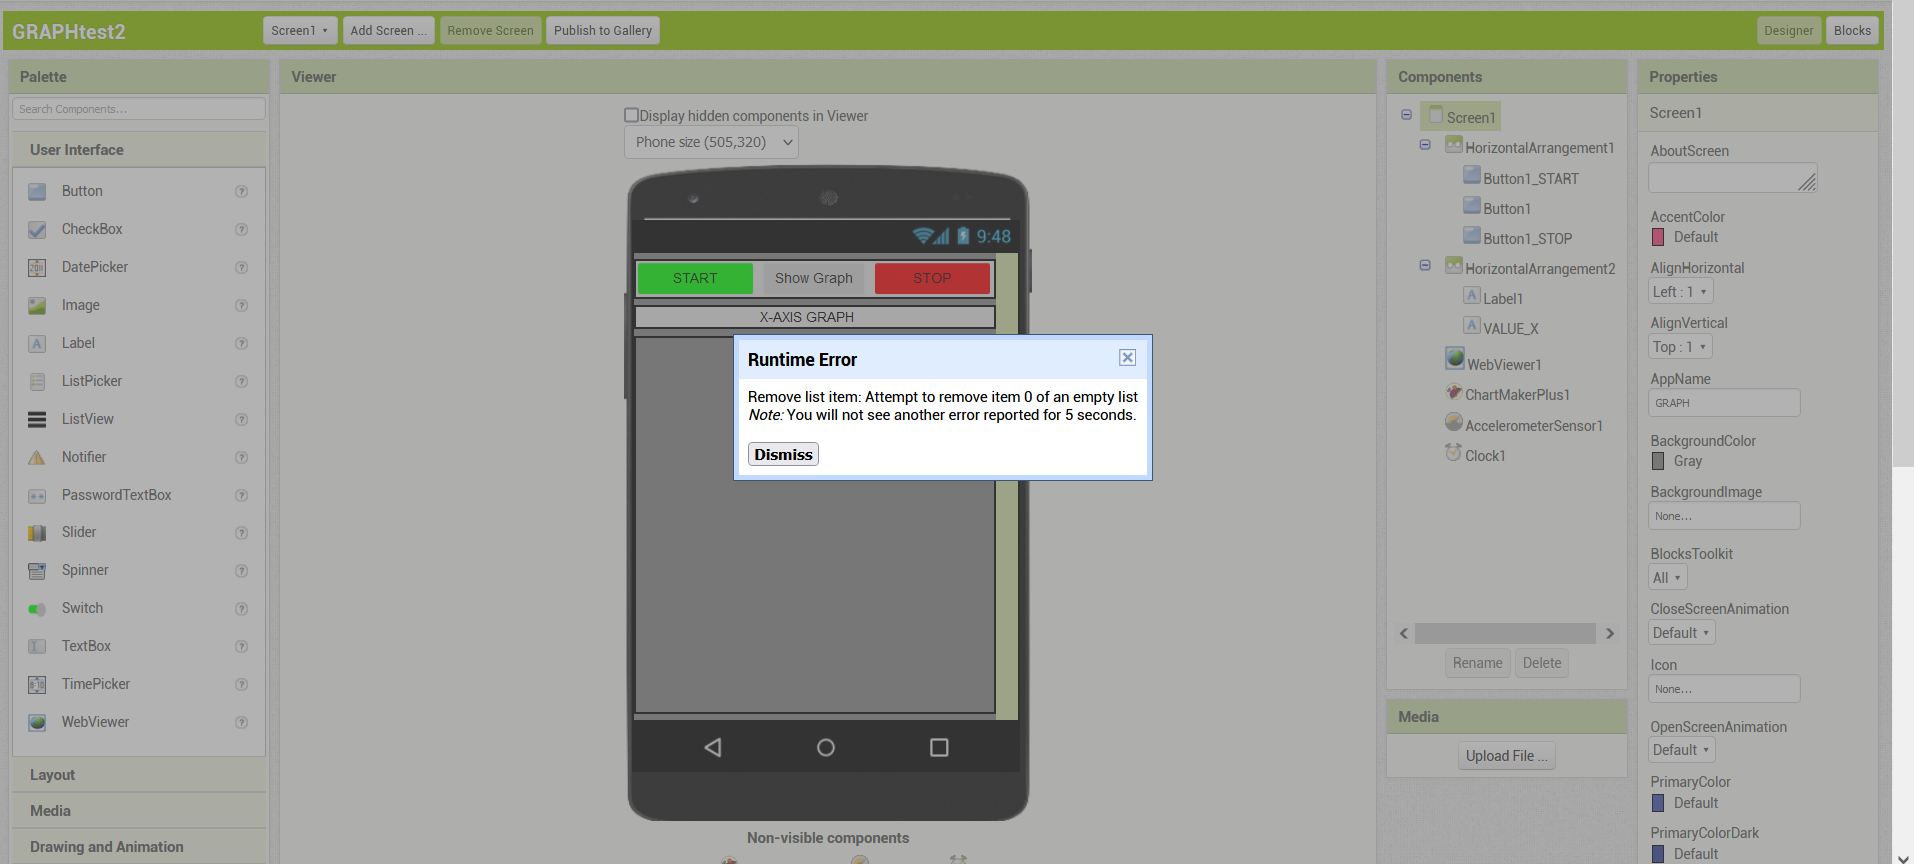
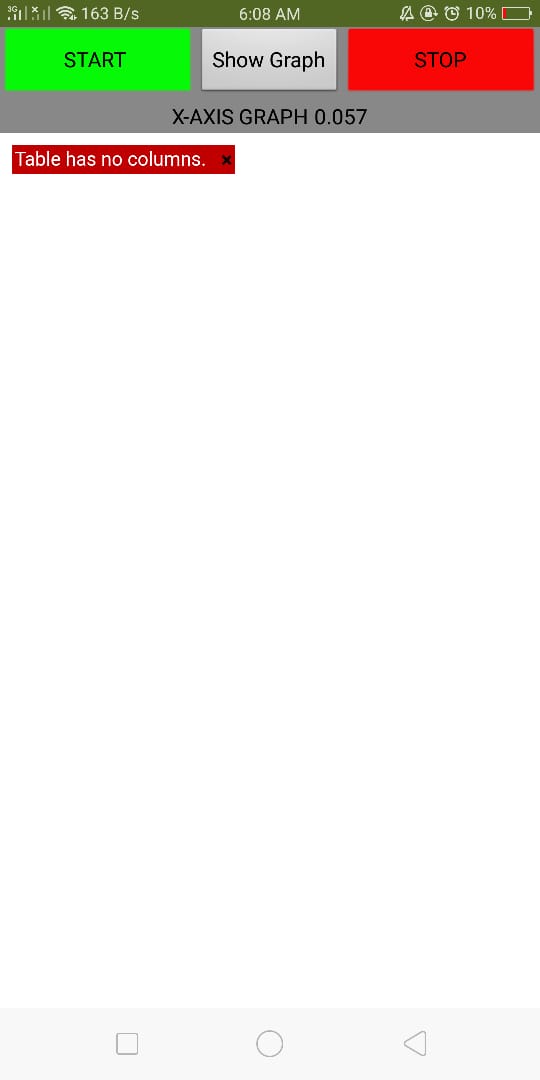
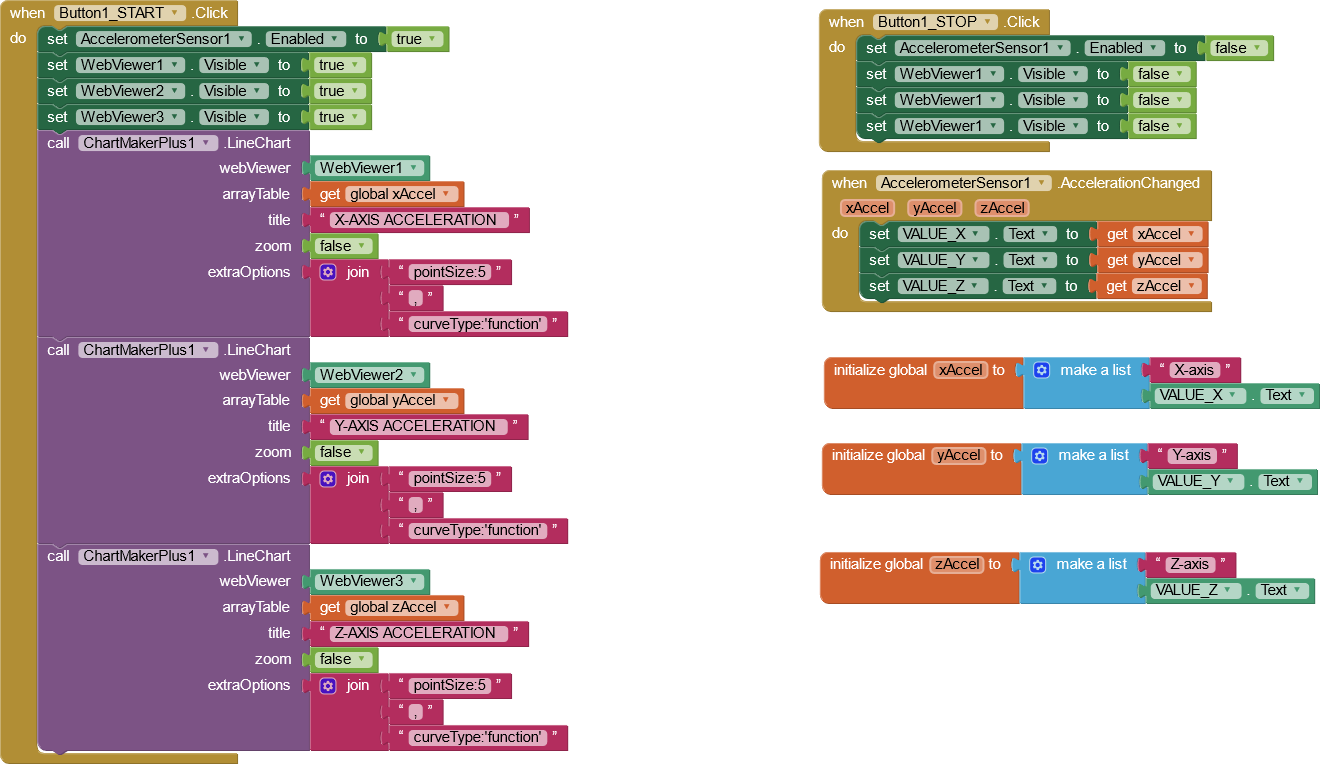
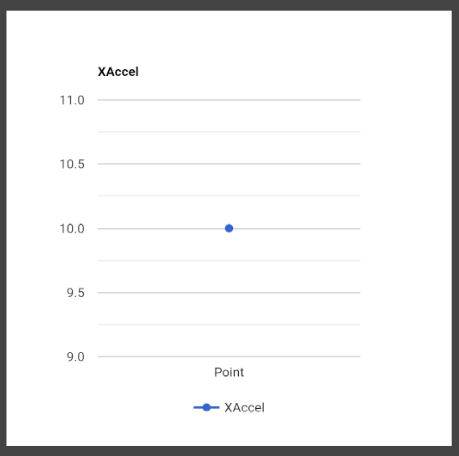
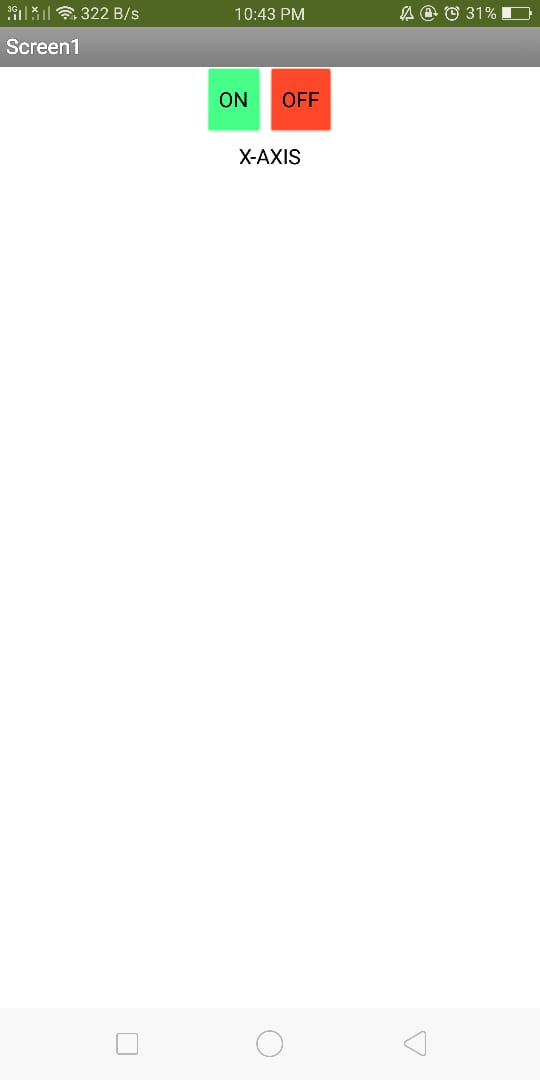
Hi all, recently i tried to create a graph based on acceleration value and display on gauge,Now i am trying to make line graph of acceleration using an extension chartmaker plus.After i have done and try to run the application the graph does not show up,

the block:

Since i really dont get it i will post the ,aia file so easier for others to help

GRAPH.aia (12.9 KB)

Please help with code or maybe share the correct aia file, please dont share link to other tutorial as i already read related topic and search related topic but still stuck.thanks in advance

You need to understand the data structure required for arrayTable:
https://developers.google.com/chart/interactive/docs/gallery/linechart#curving-the-lines

This (as you have done) will not generate a chart:
image

This will show the single point
image

image

This will show a curve, using fixed start and end points
image

image

You may also need to test for values returned from the accelerometer, so that you can replace with a default value if no value is returned

1 Like

@TIMAI2 Perplexed.

Some help appreciated. The right side code renders an image of the graph; the left side does not.

Because it does not have an axes identifier or because there are too many points.

Any ideas? Tnx

1 Like

Correct, no headers identified

OK, thanks. perplexed2

However when I add the headers, this doesn't work either . :cry:

1 Like

well i tried a simple graph and it does not work :cry: and i have no idea where i did mistake

i did also compare to graph example in demo given ,it works :zipper_mouth_face:

result


my result vs demo example

did i miss anything?

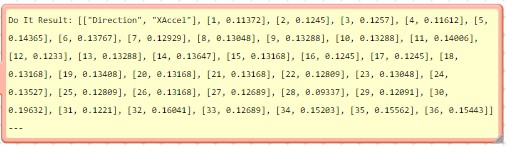
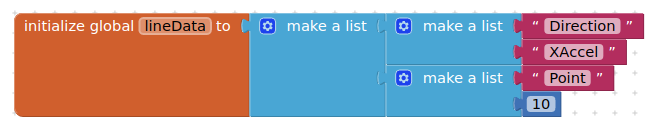
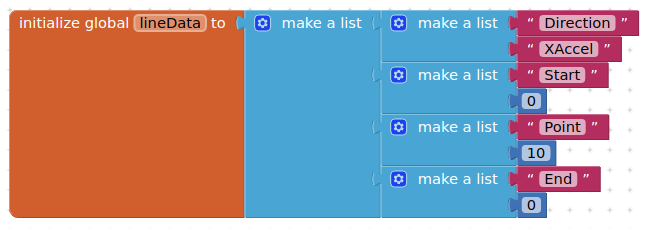
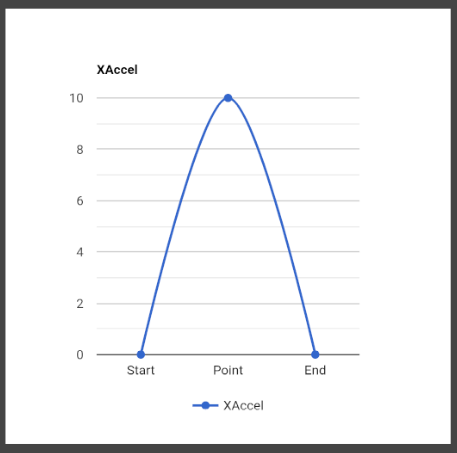
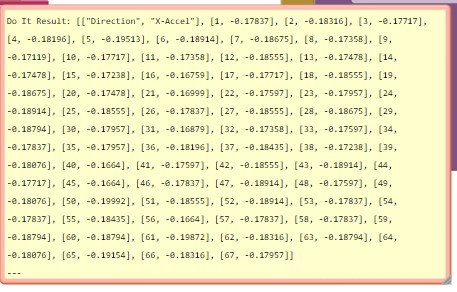
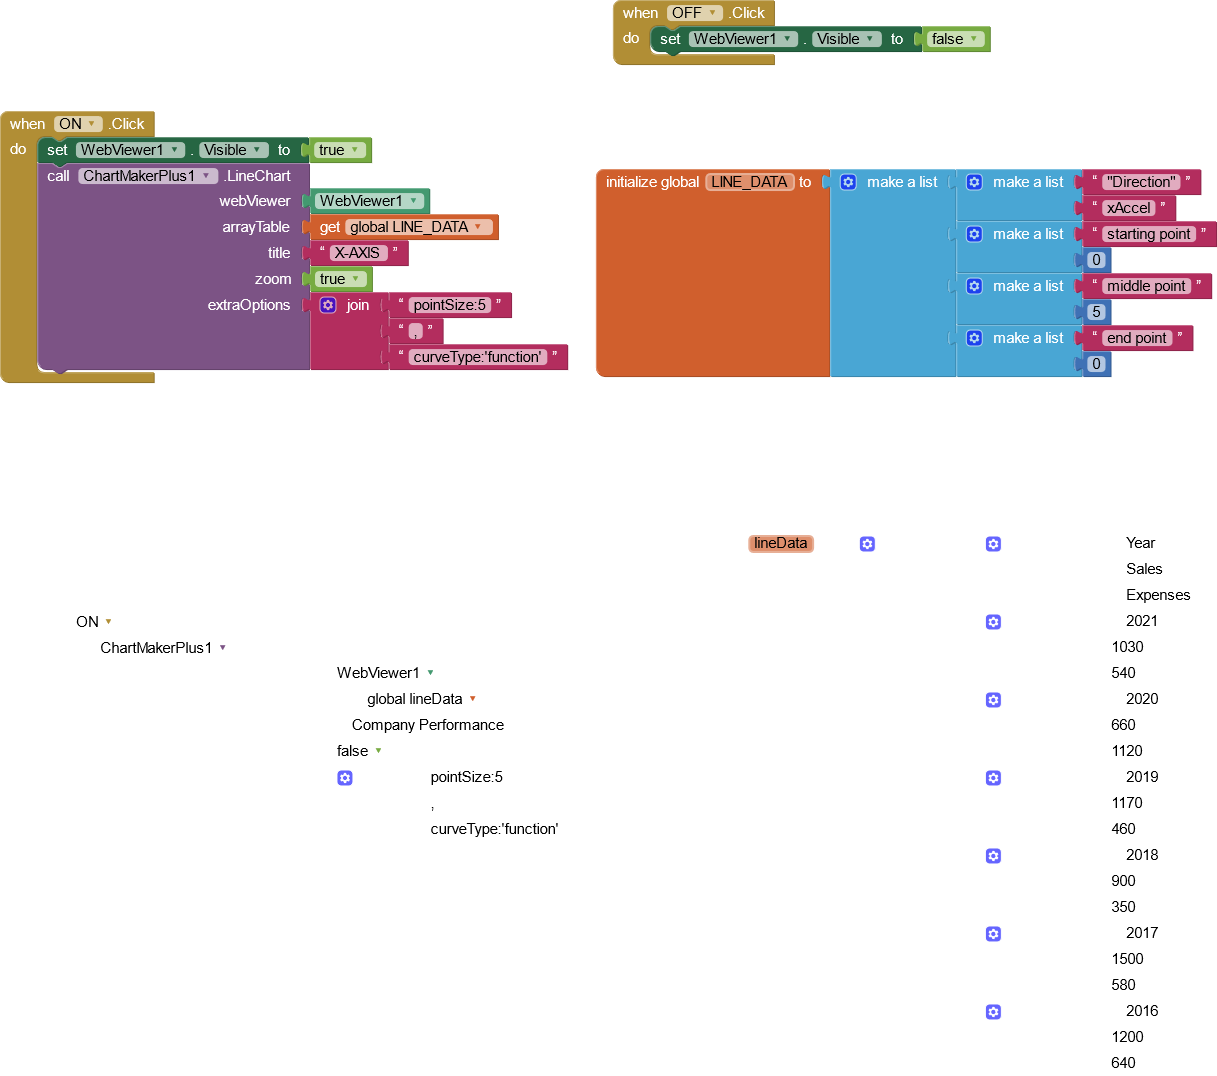
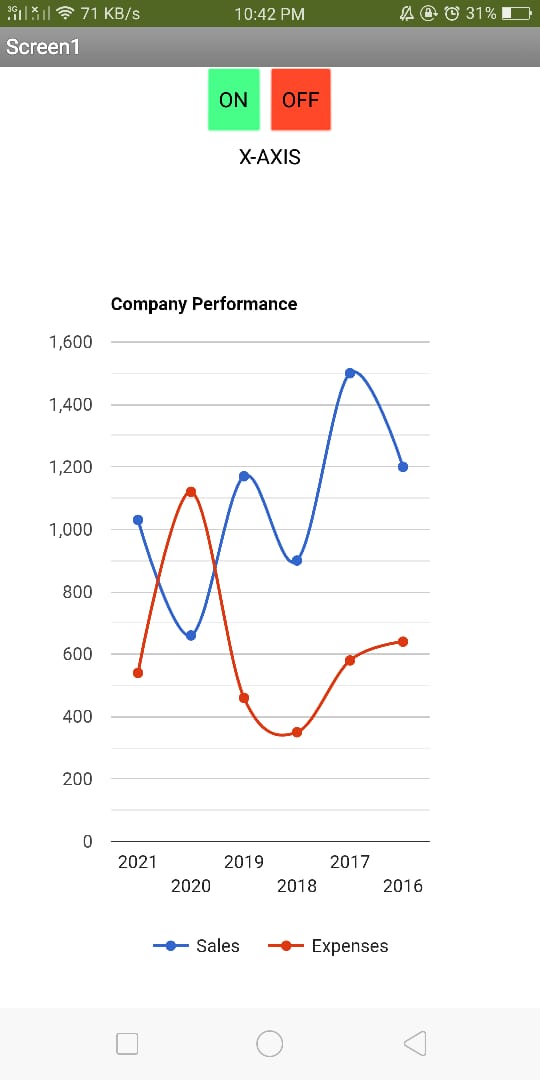
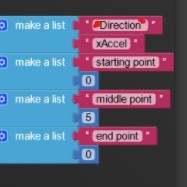
Perhaps "Direction" should be Direction. I do get a graph display when I use his example without the extra ".
Remove the quotes from this
trythis
and you may get Tim's example to render.

1 Like

thanks :sweat_smile:

Great. You gave me an idea . When I removed the quotes shown in post #5 ,
and use this similar version

the xaxis data still doesn't plot in the WebView. Perhaps Tim has some ideas?

i did try and error but doesnt seems to find the correct method.anyways thanks alot for helping out,i really appreciate it. well hopefully tim have idea regarding this issue

i did read regarding this chart that produces flickering because it keep refreshing for every new plotted data(for continuous data) but did not encounter any showing up issue so im just guessing that maybe there is incomplete code-block that should be in there

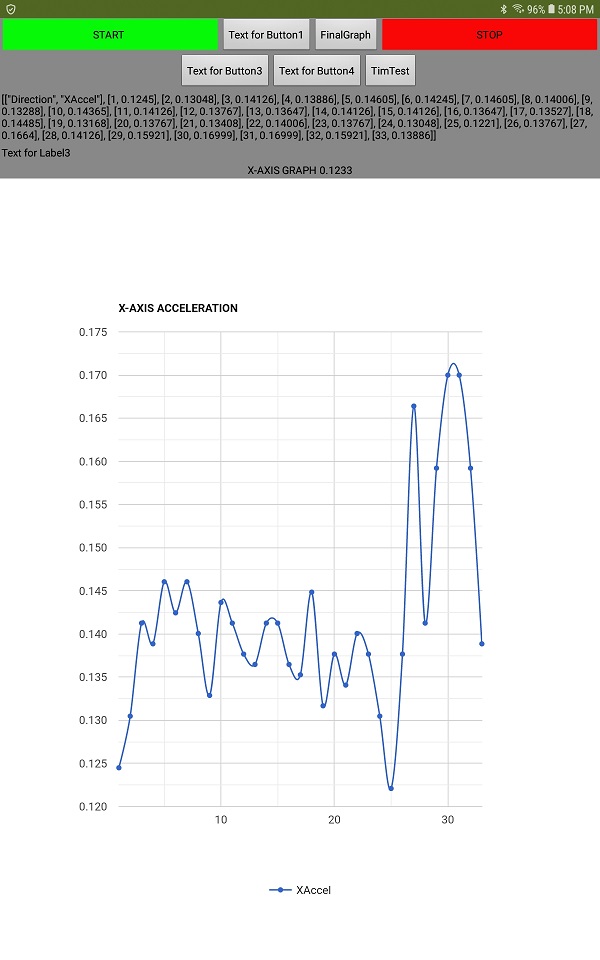
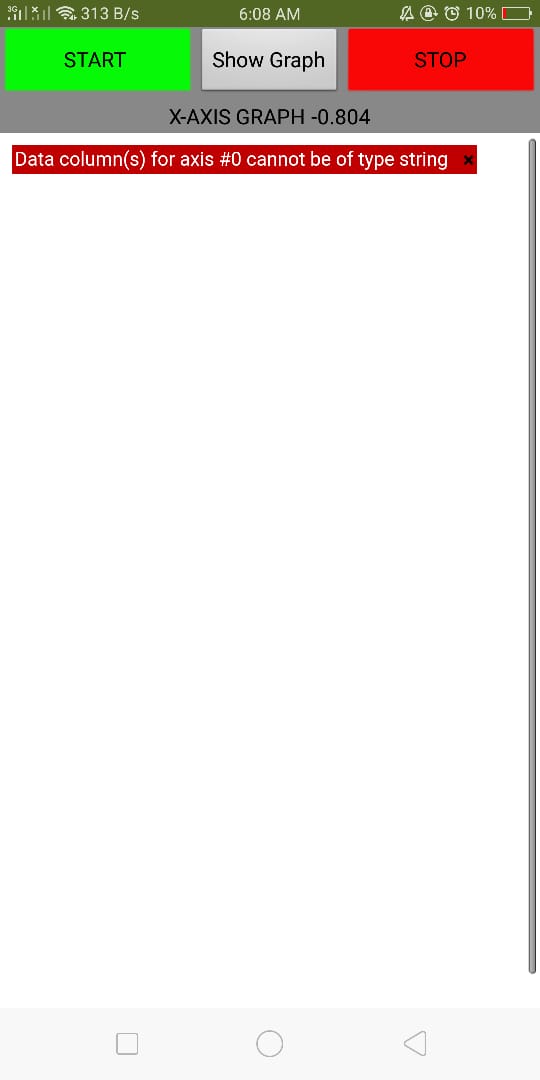
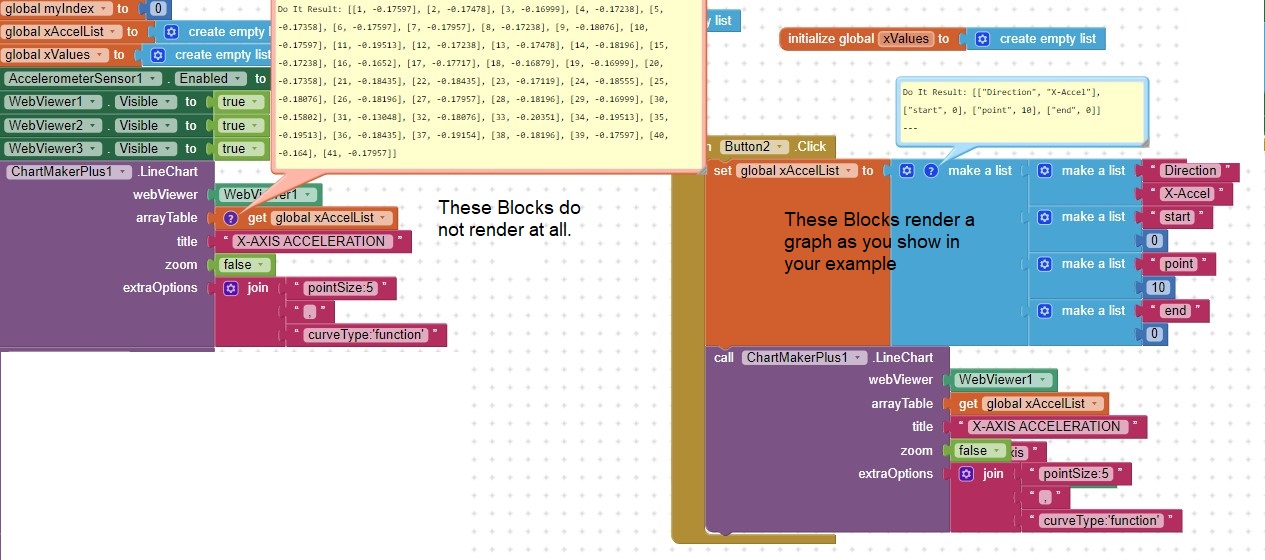
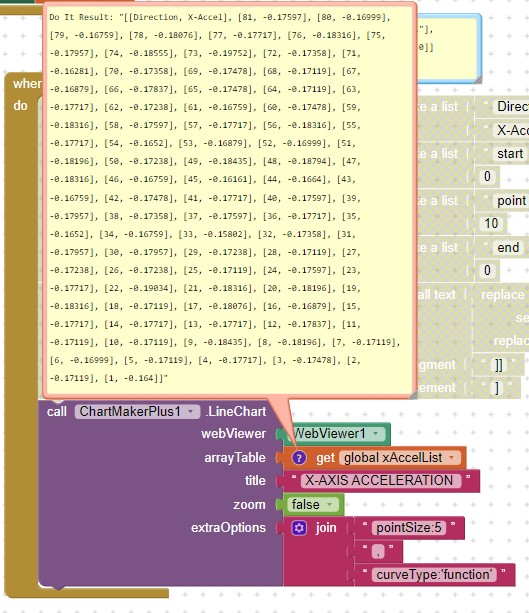
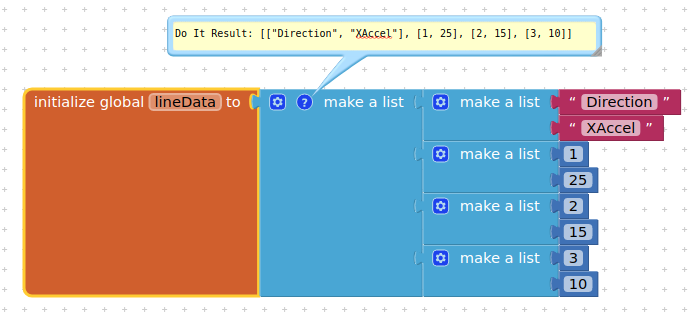
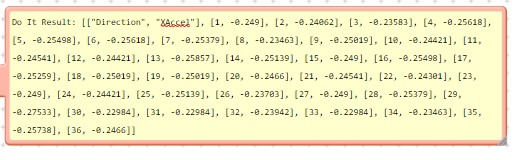
This is about data types. The line chart is expecting a string, and getting a number. If your data generator creates the number as a string with quotes, e.g. ["1",-0.164],["2",-0.1779].... then it will plot. I may have a look at reverting to the ChartMaker style of data entry which allows for setting of types for an update to the extension.

@putera_melaka you will get flickering if you try to refresh the graph with new data, I also found that trying to feed new data to the graph with the webviewstring doesn't work well. Better to generate a chart using the canvas if you want to update data in real time.

I have to correct myself having just done some testing:

will plot this:
image

You do need the headers to be in quotes.....

[["Direction", "XAccel"], [1, 25], [2, 15], [3, 10]]
1 Like

Thanks for the updates.

Tried both with ([post #5) and without (post #9) quotes; neither works. I will keep experimenting.

@SteveJG Seems you have a string and not a list (you have quotes around your brackets)

do it result: "[["Direction","X-Accel"],[1,0.25],[2,0.37]...]"

should be

do it result: [["Direction","X-Accel"],[1,0.25],[2,0.37]...]
1 Like

Oh, I have tried this too

perplexedList which certainly is a List. :slight_smile:

Perhaps it does not like the negative values?perplexedpositive

:cry:N
not negative values as shown above causing the issue.

OK... got it to work ....

I need to clean this up and then will post the solution. :slight_smile:

1 Like

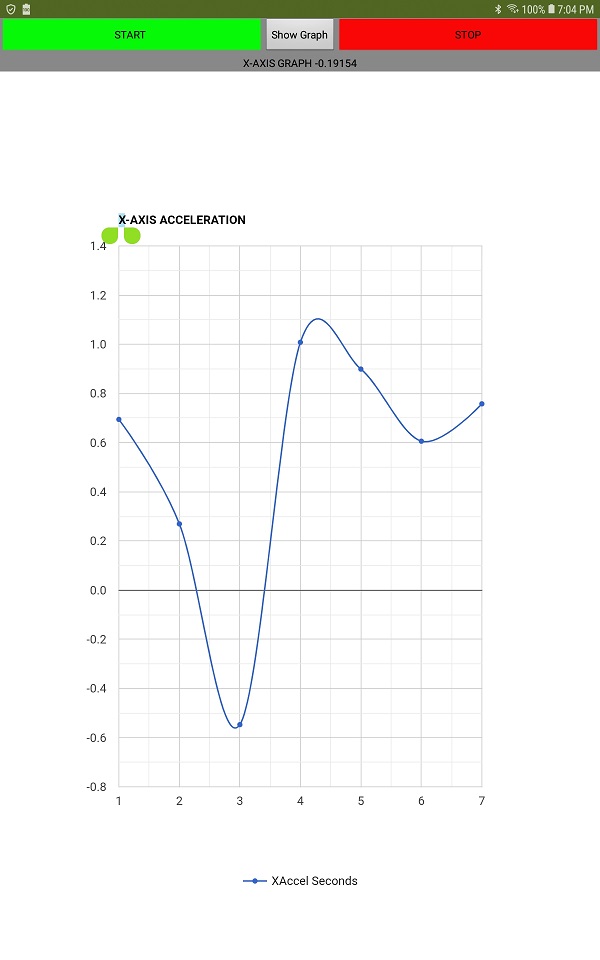
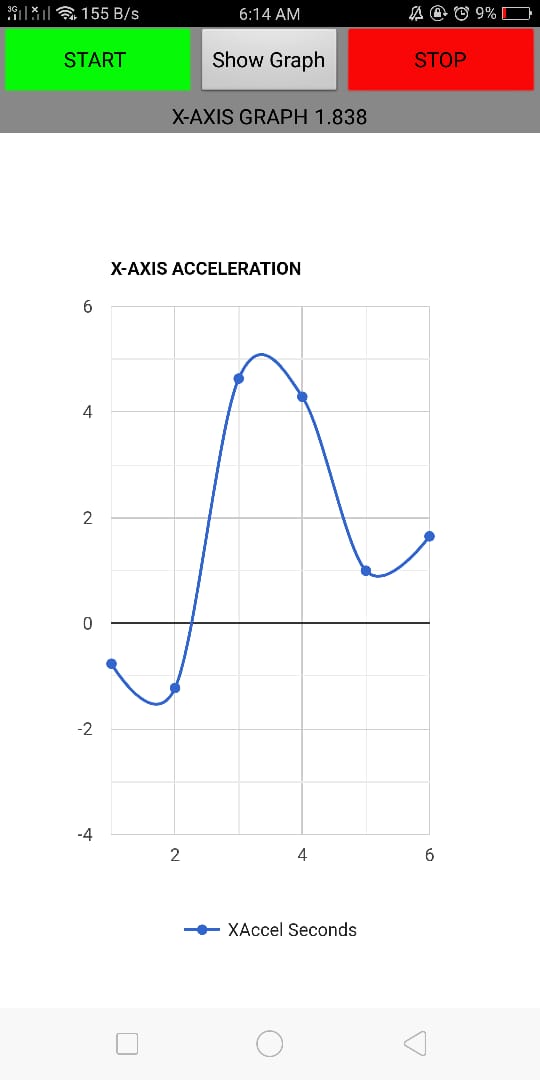
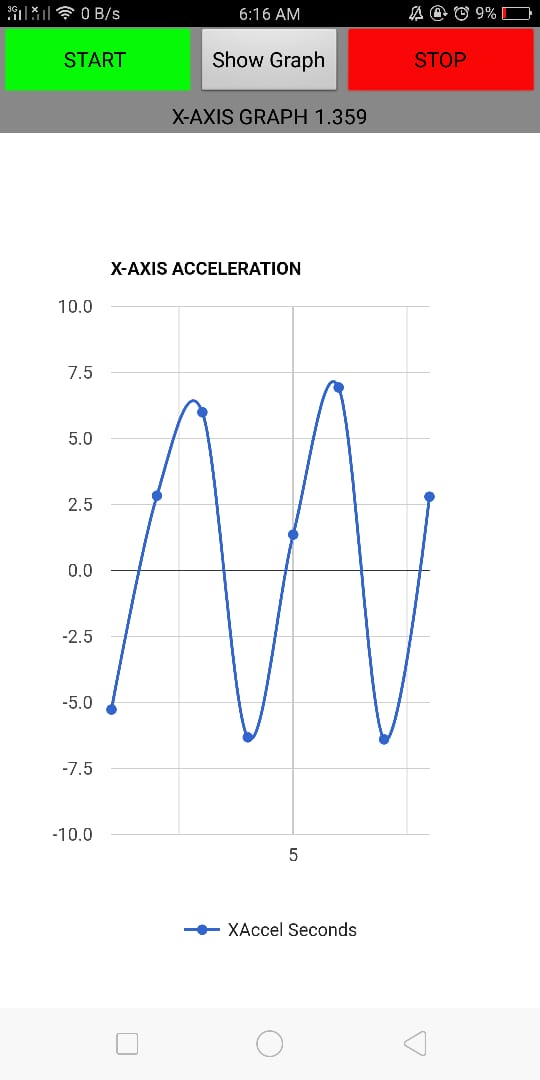
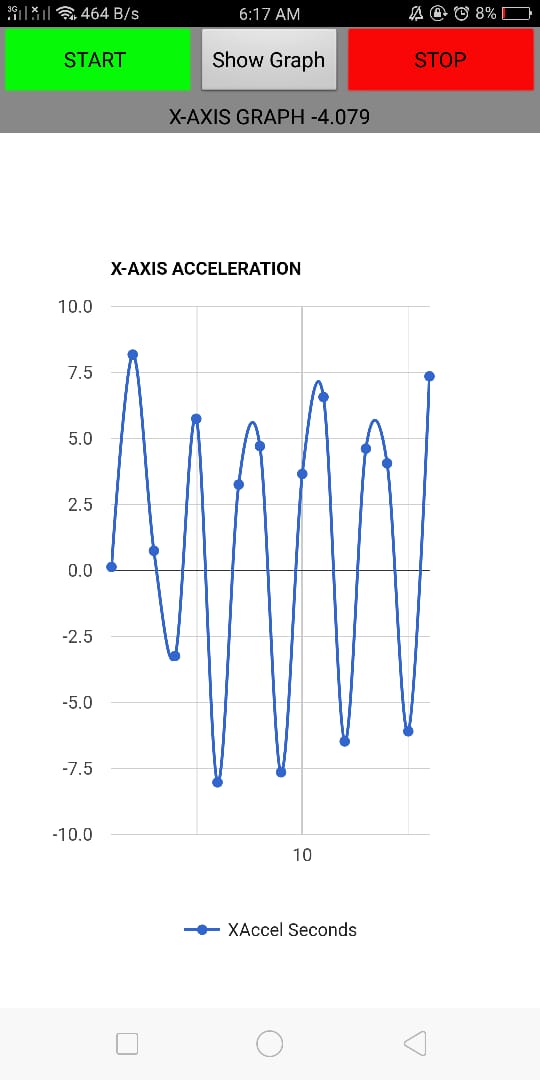
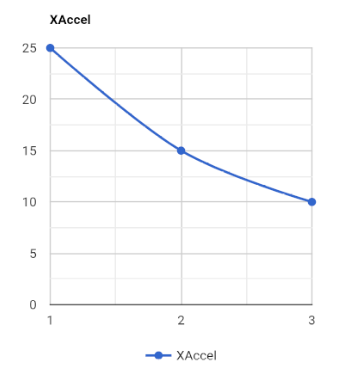
Cleaned up a bit. Used @putera_melaka aia as a base and modified only the x-acceleration.
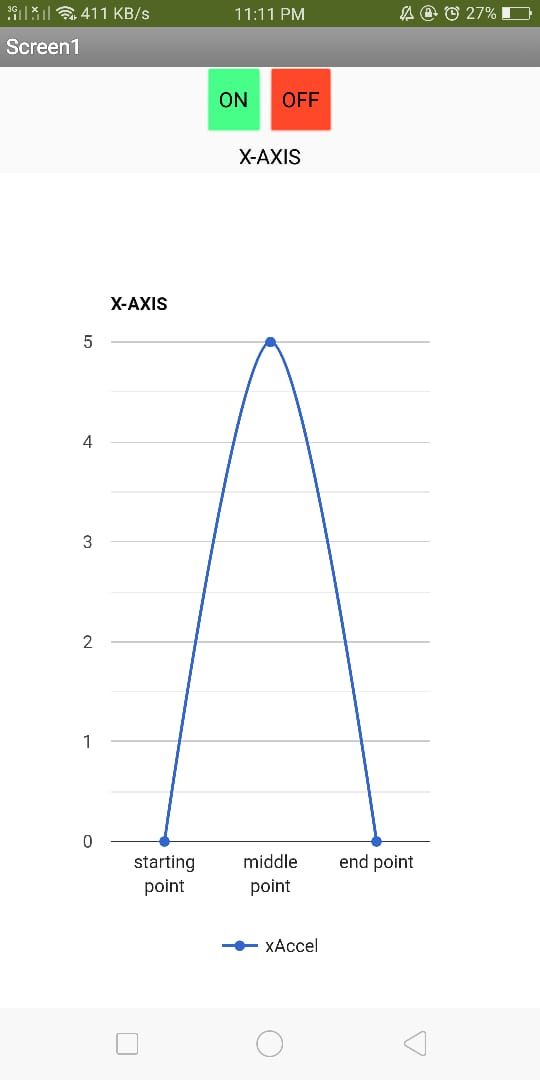
Select START ( 1 ) let run a few seconds inducing acceleration change, select STOP ( 2 ), then Show Graph. This is not real time. Uses a Clock to smooth the acceleration data sampling once a second and displays points collected on the xAccelList between steps 1 and 2. You could save the List in a TinyDB.
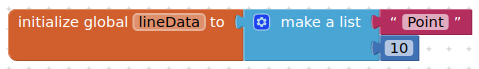
Can the technique be used used to draw the graph in real time? Experiment and find out.

GRAPHtest2.aia (14.9 KB)

1 Like

i did test it (start-end-show graph) but most of the time the result as below:

app inventor:

ai companion:

i will install and try it more

after install as application everything works great

:sweat_smile: :sweat_smile: willl try but not sure how the result gonna be

A different chart call is required for this, not one from the extension

since the main problem as stated in original post has been solved it fair to mark the solution given.thanks to @SteveJG @TIMAI2

however the minor problem thats needed the graph to show acceleration value in real time is not solved and still in experimenting state.