Glad you got it working. The Project works fine using the Companion for me as does building the apk and loading the compiled Project.
1 Like
i will first try to make for Y and Z axis the proceed to try and make it real-time moving graph.Thanks alot for helping out .
See attached an example of using google charts with real time data.
rtGoogleLineChart.aia (3.1 KB)
Notice that the "clock" is running in the html, not in the app, and ensure that any values passed with the WebViewString are converted to numbers (see where I used parseInt() - there is also a parseFloat() ).
This example uses a changing webviewstring value to run the loop, you need to feed your realtime values into the when webviewstringChanged block. This seems to run OK for a 1000ms interval, i don't recommend going below this, there won't be enough time to turn things around at the google end.
There may be additional "cycle" issues if/when trying to run three graphs at once ?
1 Like
Here is a very different way to plot x,y,z using a Canvas in real time.
One developer developed a ‘seismograph’ using AI2 and the Accelerometer. He plots smooth x,y and z curves simultaneously. The example might be something you could do to plot your data… see Seismic …Look at the aia on the 6/25/14 post . What this developer does might suit your purposes but be aware he has a simplified approach to smoothing. See the discussions of possible ways to filter the accelerator data stream discussed here> Filter the errors of accelerometer readings from smartphone using mit app inventor .
1 Like
alright i will into that ,it comes with sample project, thanks alot
thanks alot, i will look at it,,still learning and considering between webviewer and canvas ,
A couple more projects for you to test:
rtGoogle3LineChart.aia (3.6 KB)
(runs three lines of real time data on single chart using random numbers)
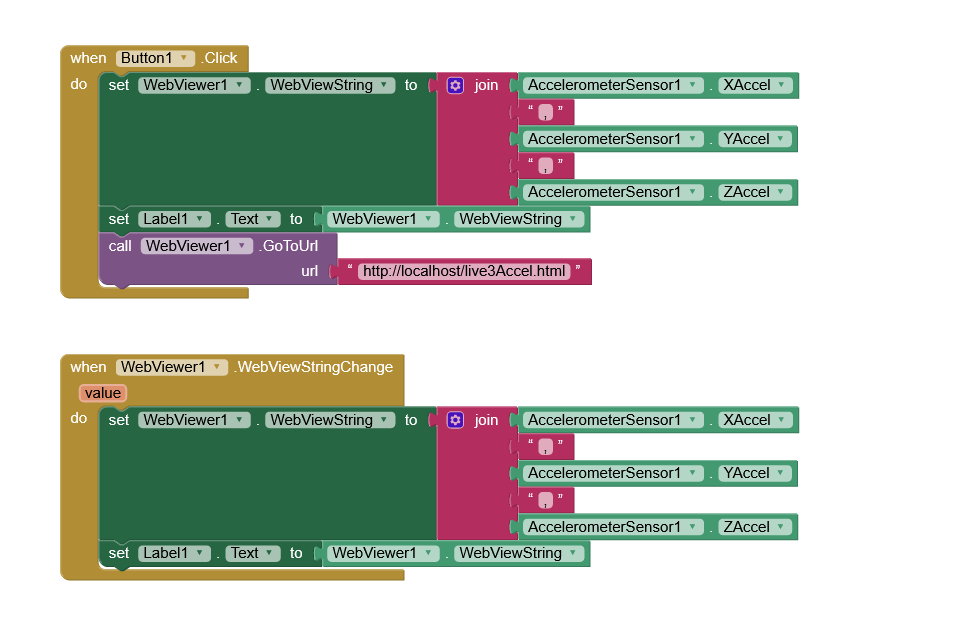
rtGoogle3LineChartAccel.aia (3.4 KB)
(runs three lines of real time accelerometer data from device)
1 Like
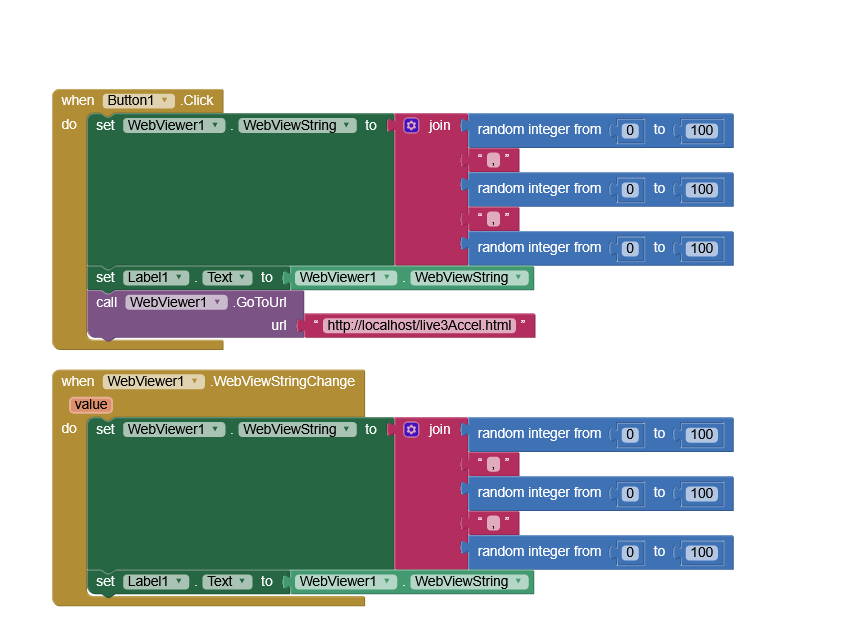
yes this one generate random integer 0 to 100
this is exactly what im searching for!
maybe i will try to make 3 webviewer for each axis or just use 1 to display 3 values ,,will do experiment and use the best one ![]()
thanks ![]()
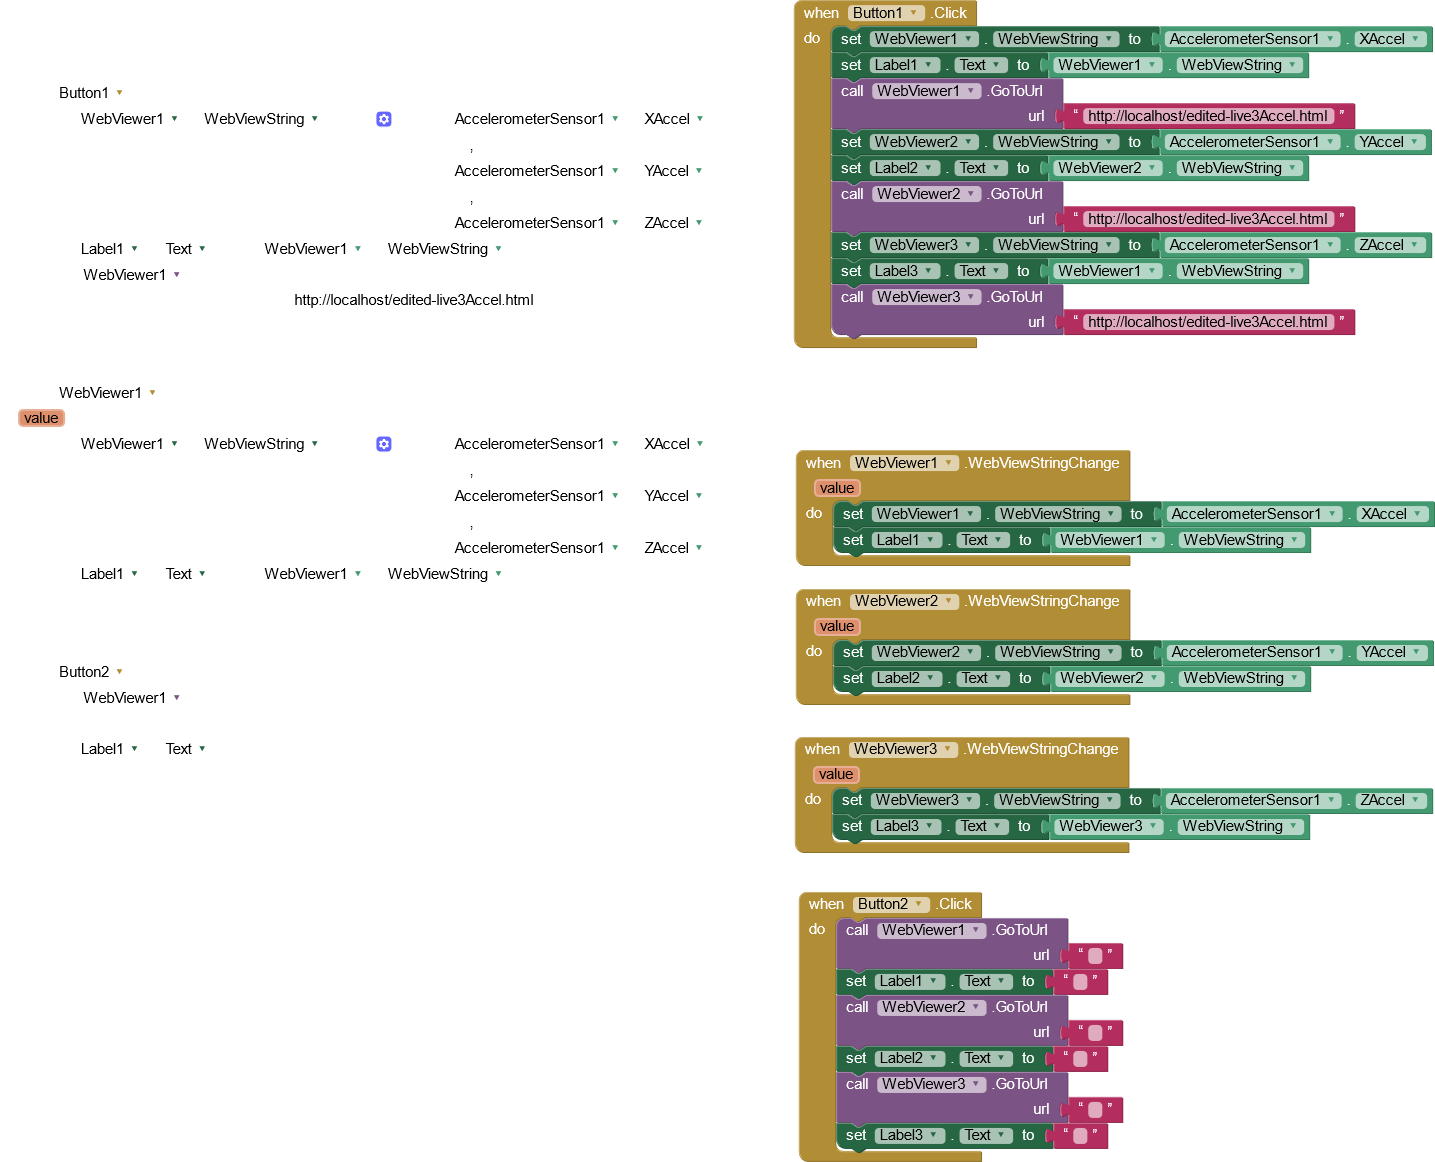
well i did change to 3 webviewer and set it to display each graph of x y and z
The result (AI companion):
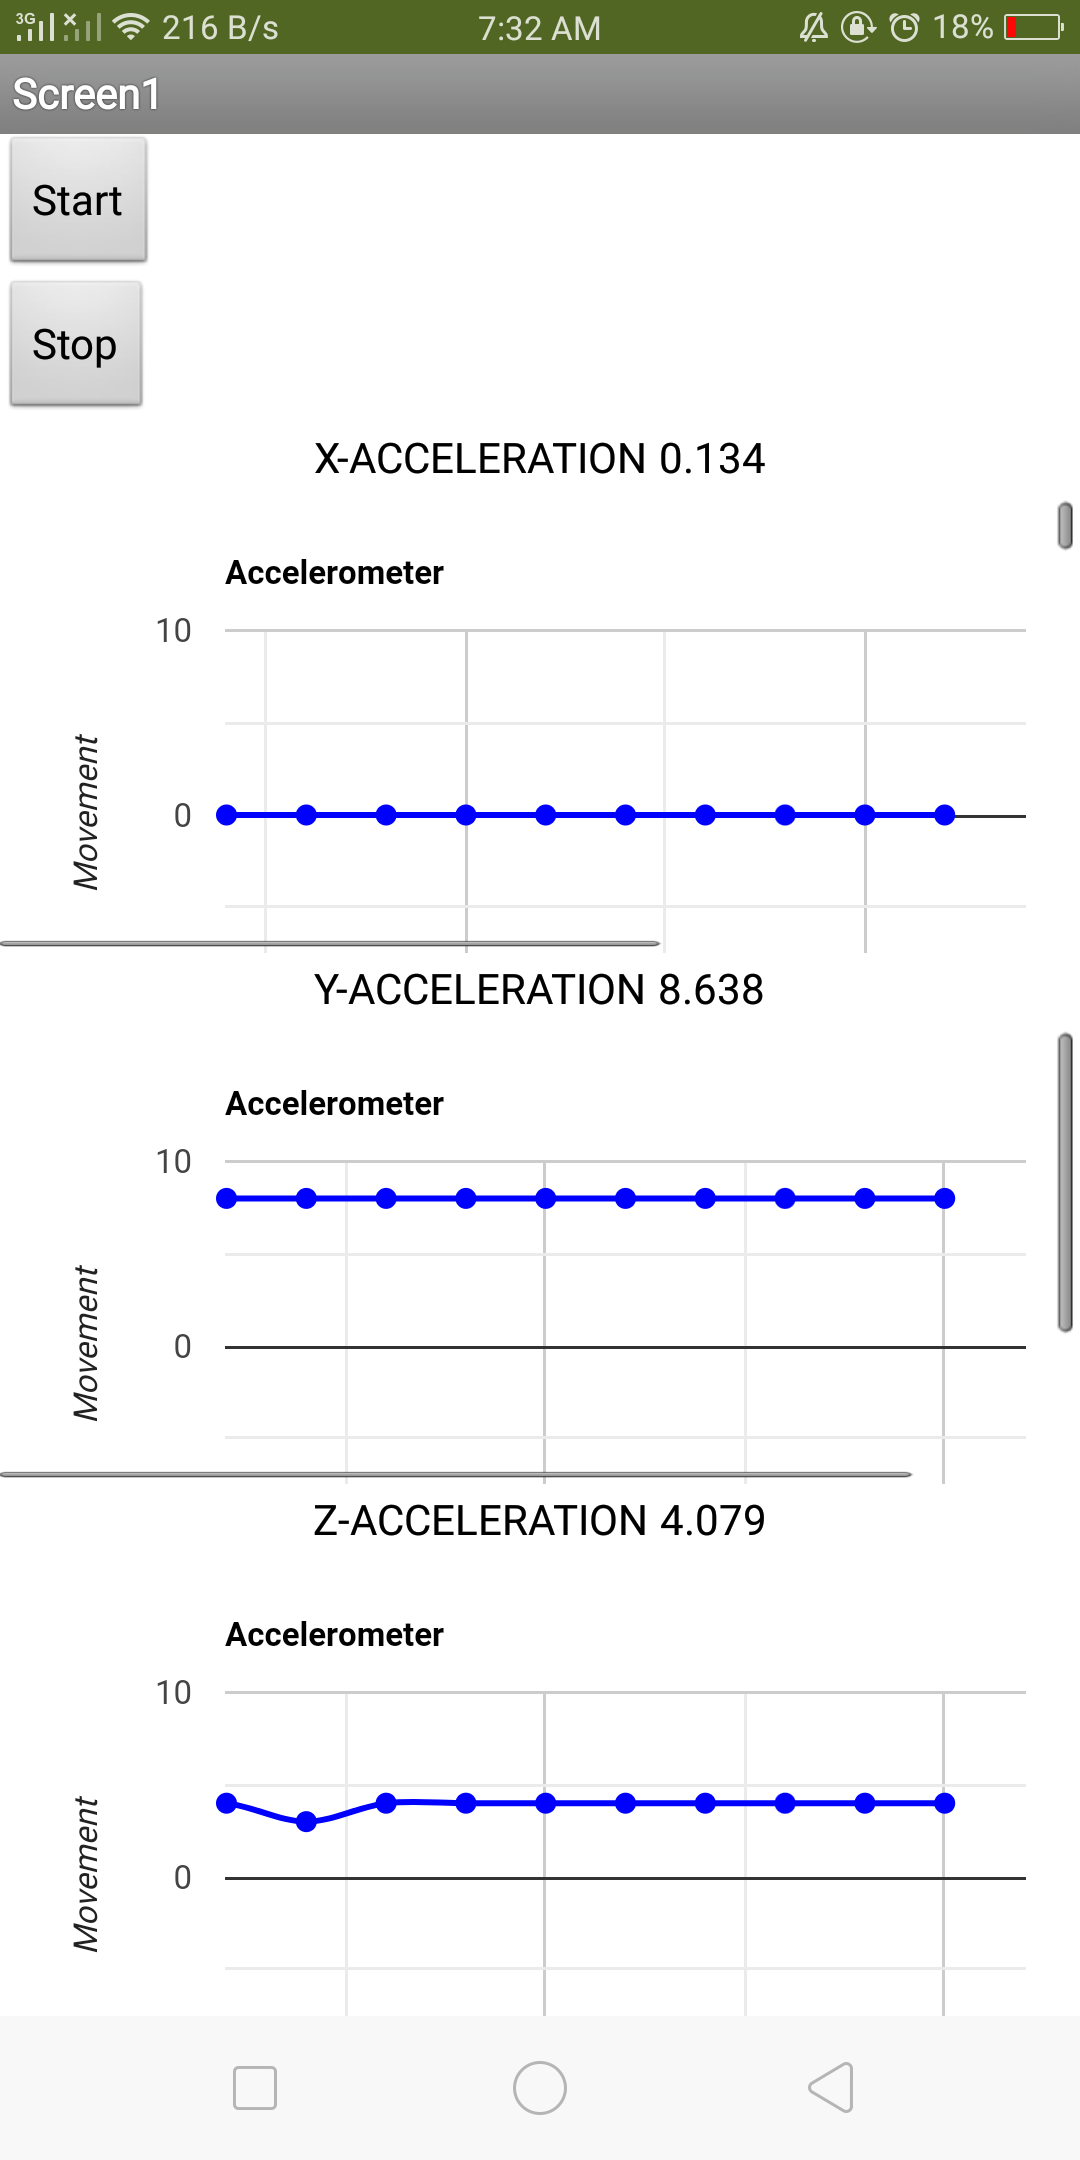
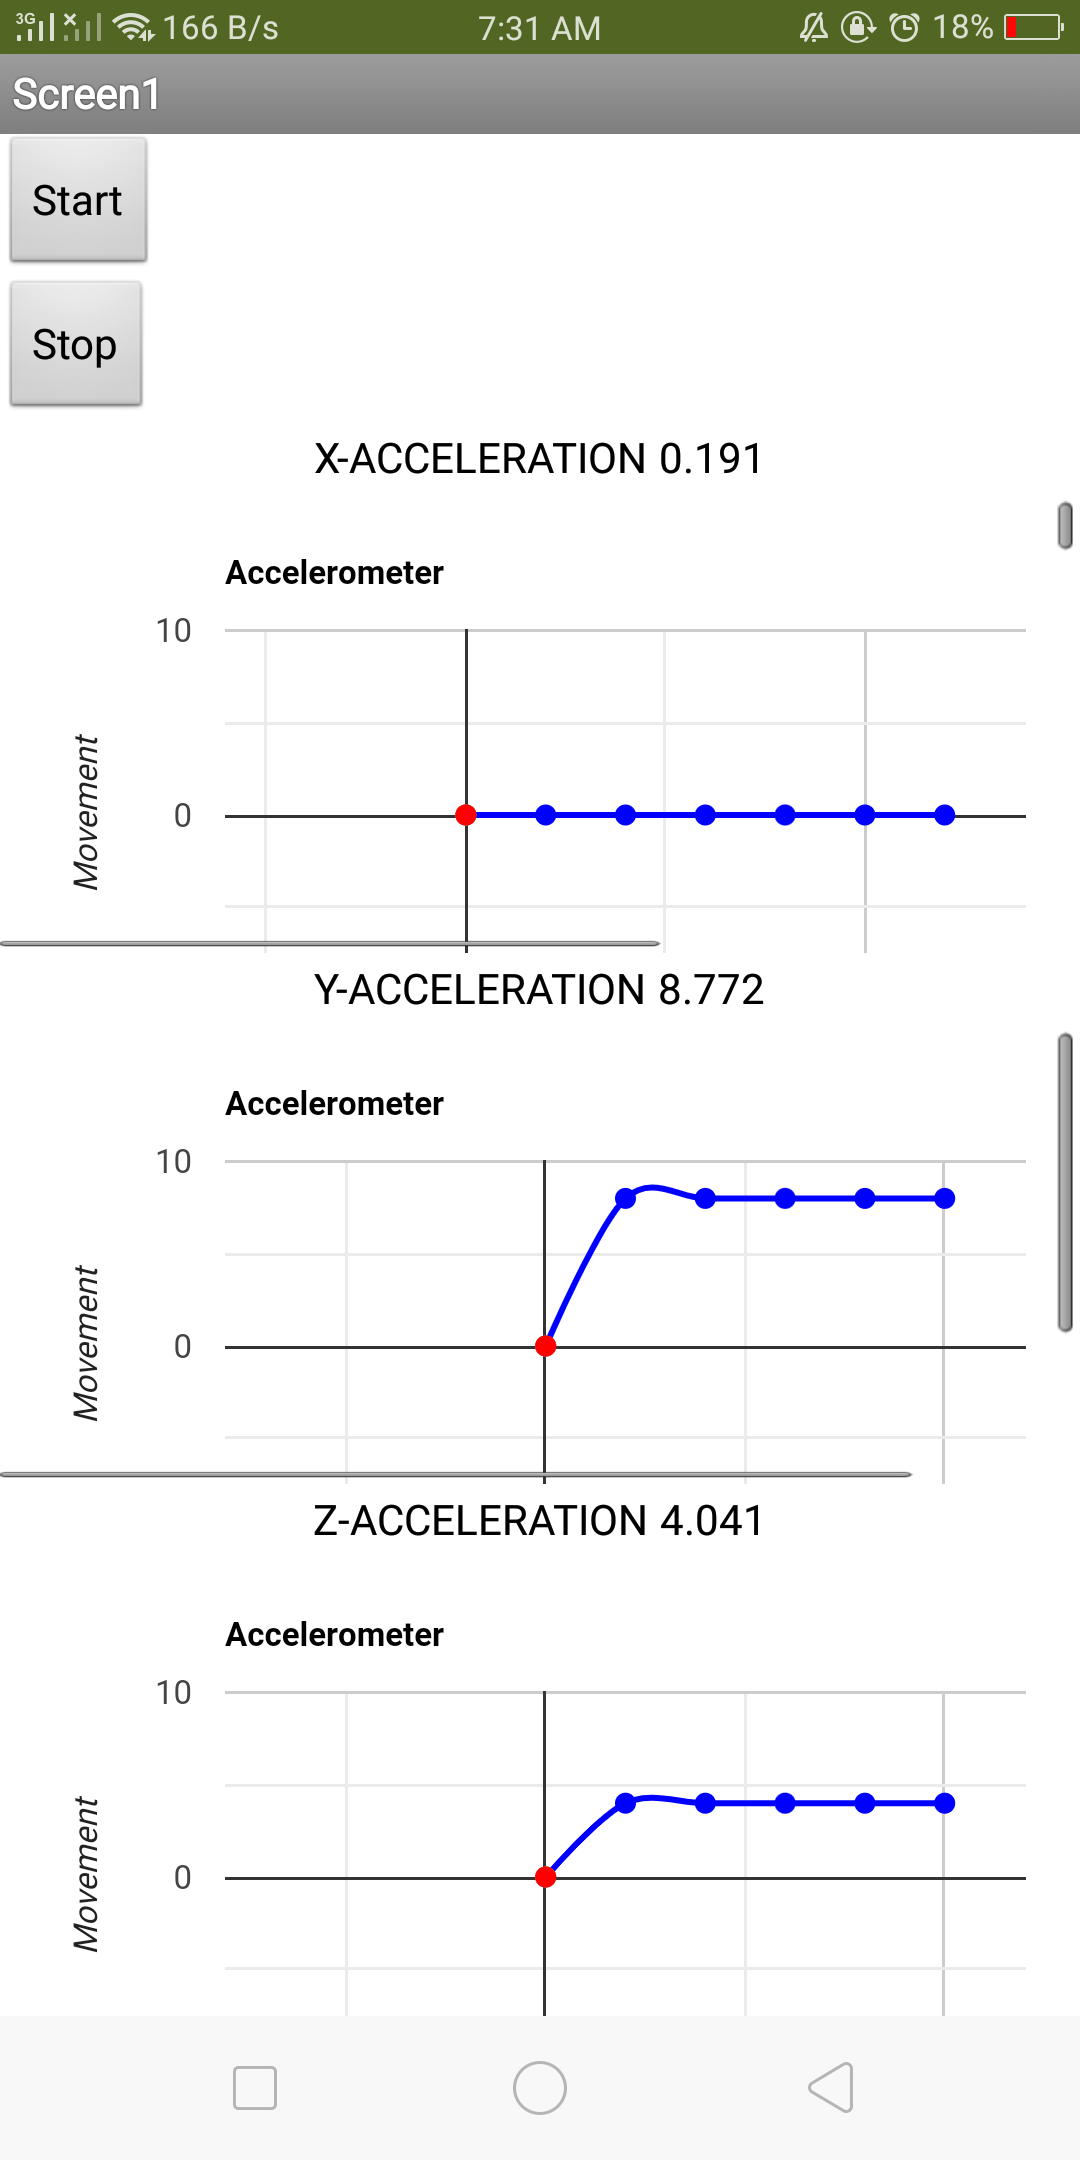
i did change the code max 10 min -10
i have few question
- do i need to make separate html file for x,y and z(as i realise the colour is set to blue which refer to x-axis colour even for y and z)
2.how do i make the graph fit perfectly(which code do i change? is it the pixel?)
3 graph line accel.aia (6.4 KB)
This topic was automatically closed 7 days after the last reply. New replies are no longer allowed.