in gotValue event, adf If tag=x, then....else if tag=y, then ....
and only when you get all data, then show chart.
in gotValue event, adf If tag=x, then....else if tag=y, then ....
and only when you get all data, then show chart.
Hi Kevin, thanks for your answer. That´s actually my problem, i´m not sure how to get all data withouth interfere with the other variables. i´m not getting what you are telling me. Sorry. Also i don´t know if the "when boton_actualizar. click do" event is fine and the modifications i have to do are only in the .gotvalue event. i understand that the block i have to use is the "if, then, else" one but i don´t know where should i put it in the "gotvalue" event and how to fill it out.
Do your four pieces of data have to be under the root of the structure, or can they go under a projectBucket e.g.
https://dogfeeder-70168...firebasio.com/
|
__ColumnChartData
    |
    |__AguaChico:13
    |__AguaGrande:32
    |__ComidaChico:2
    |__ComidaGrande:20
If so, you can call back all the data in one go and apply it to your chart accordingly
if making that doesn´t interfere with my "writing blocks" that i have in another screen, it would be the same for me. these are the blocks i´m talking about:
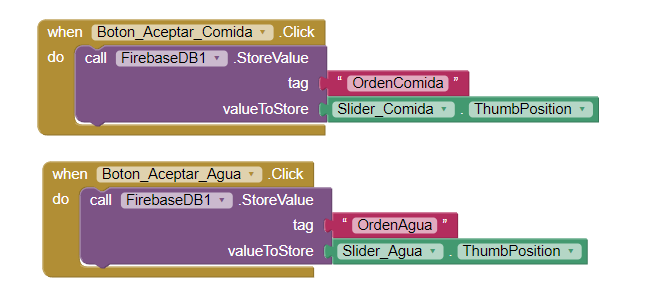
i think it´s irrelevant but i´m asking you just in case.
No, it will not interfere with those two items, although you could do the same thing for them as well....
actually, i would prefer keeping those blocks under the main root because of my arduino code, but it´s easy to change the code according to that, nothing more than that, so if putting it under a projectBucket is way easier, let´s go on with that.
Perfect, it´s working clean. Honestly i´m not sure what you have done, i don´t understand it well, mostly the "Web1" block because i didn´t have that in designer part so i had to add it. i´m glad i entered this post, you don´t know how thankfull i am with you. Sorry for all the questions and problems. Also i don´t know what the "projectbucket" part in designer´s window do. or what should i do with that. but thanks for everything.
@TIMAI2 This extension is really good. I wish to use your ChartmakerPlus extension in a project I am creating for the MIT Appathon 2023. Do let me know if you are ok for MIT to redistribute this as part of the competition.
The extension is great, but I need help.
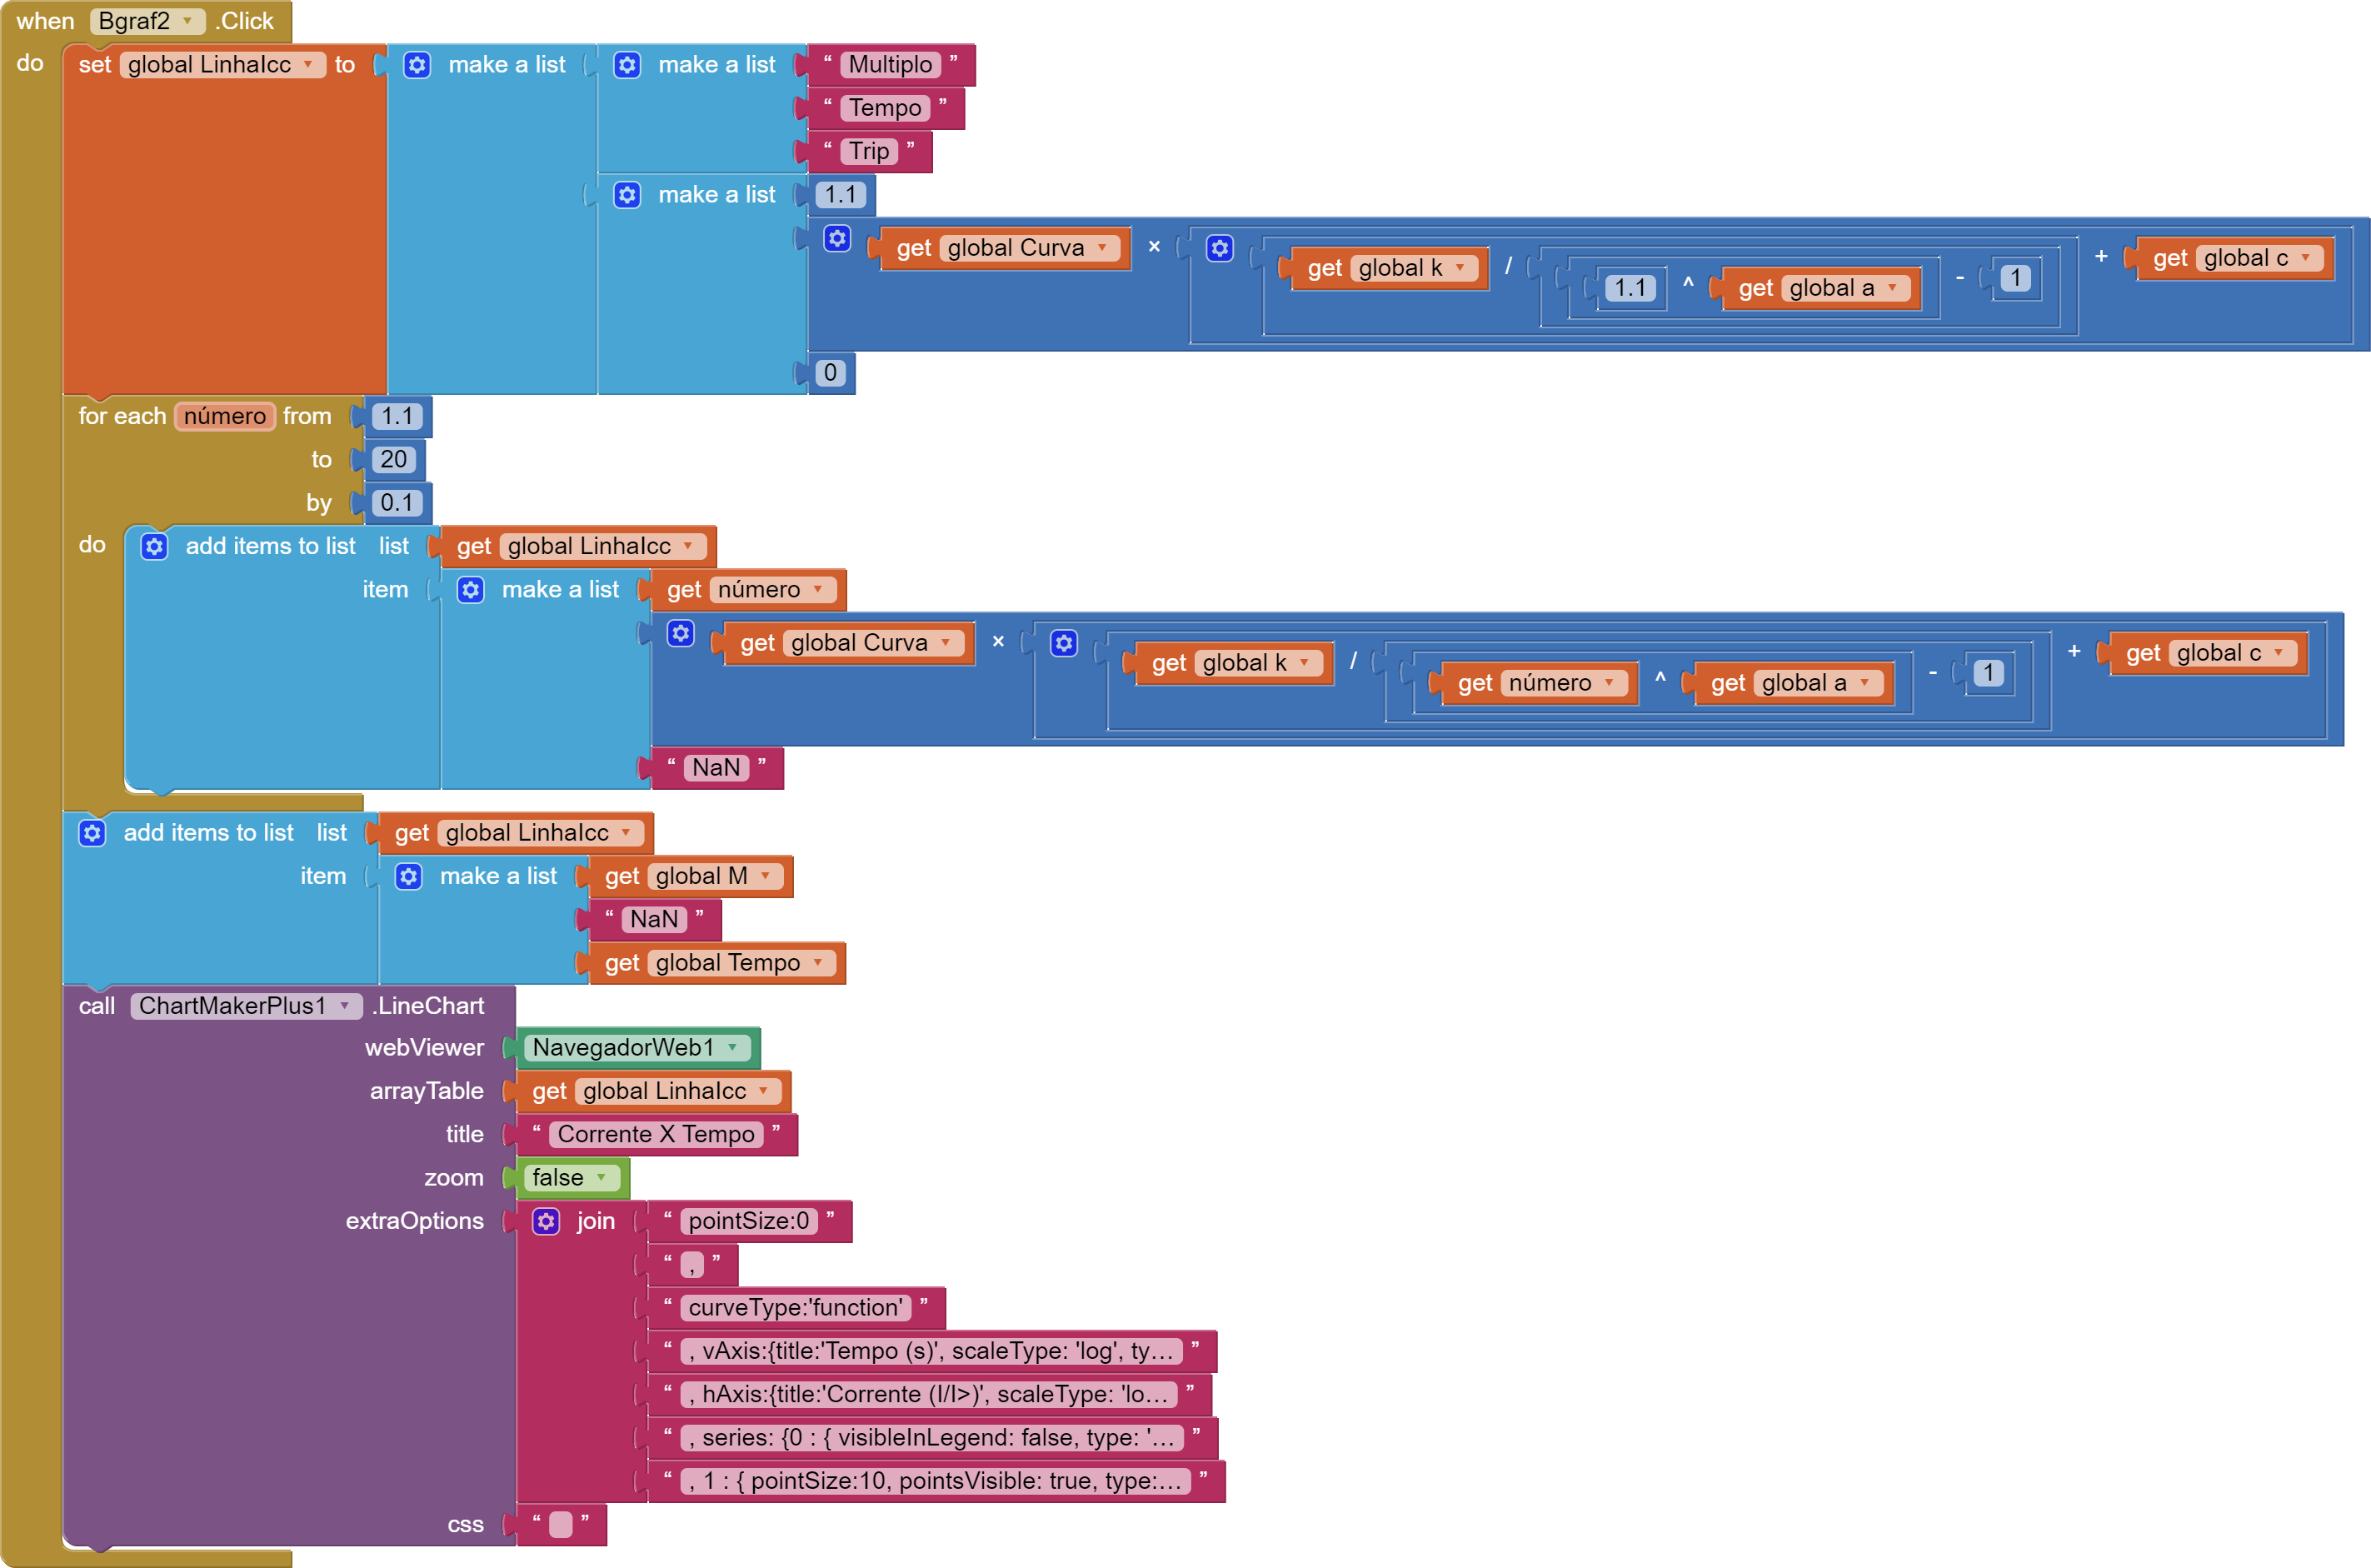
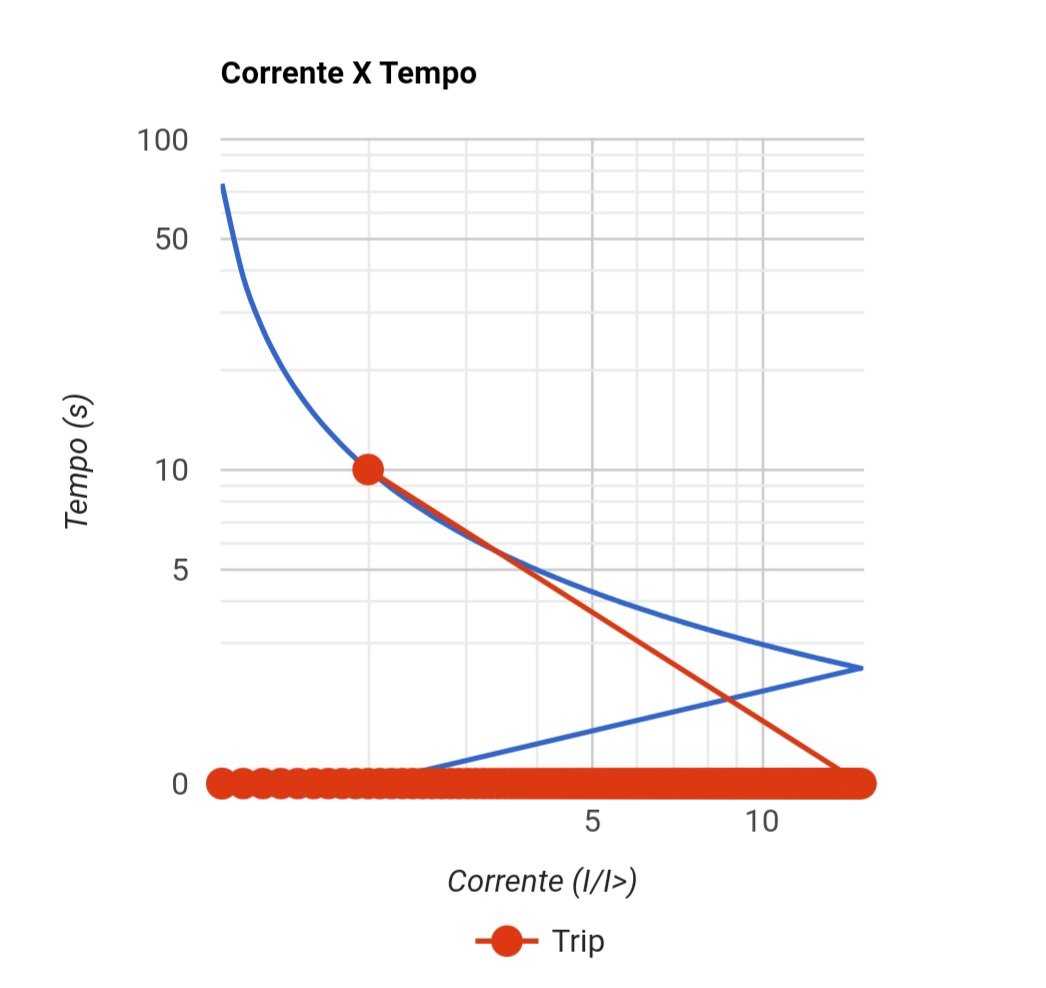
I want to make a line graph consisting of an exponential curve with a red dot to highlight a specific point. All this with a logarithmic scale on both axes. The problem is that the table does not allow the value in the first line to be filled with "NaN" or "none", and in the logarithmic scale it sees the second series of values as continuous, even filled as empty.
It works perfectly with just one series,.
If I use a non-logarithmic scale, there is an annoying red dot at the origin
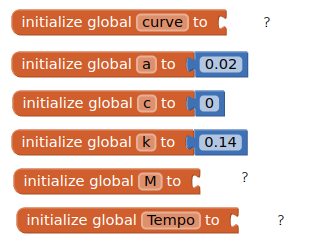
What are your k, a, c, M, curve and tempo values ? (all your unshown variables used...)
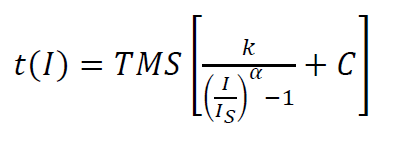
TMS is user choice
I/Is = M
And the graph have M in H axis and t (time in seconds) in V axis
k, a, and c are constants used to plot the curve and depends on TMS choice.
Standard curve have k = 0.14, a = 0.02 and c = 0
I am hoping to reconstruct your dataset being passed to the arrayTable. Without all the values I cannot help.
I tried to redo the table in a summarized form. In the first column would be the X, in the second column the exponential function and in the last column would be the point to be highlighted. I can't set as empty the first element of the third column. It always gives the error of "All series on a given axis must be of the same data type". So I had to put, against my will, "0" in the first cell. Attached is the summary .aia. The Second graph is with non-logarithmic scale, where the empty cells are disregarded, except for the first one.
Curve.aia (13.7 KB)
Can you fill in the blanks ?
My initial guess is that google charts is not accepting mixed data types, expecting a number when it gets a string (NaN)