sorry but how do I do it with tiny db 1
Sorry for my ignorance but I don't understand much about it
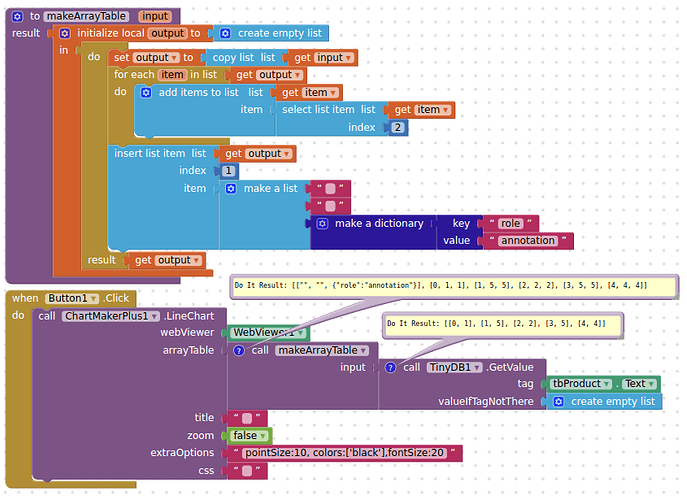
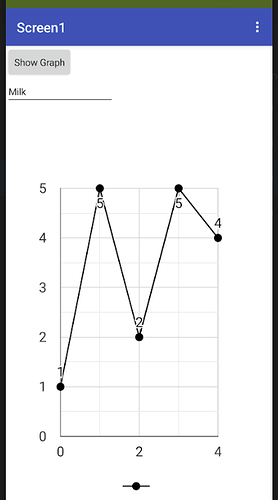
You should be able to see what your "arrayTable" needs to look like, from my example. You will need to add the required items to your list coming from the tinydb so that it has the same format.
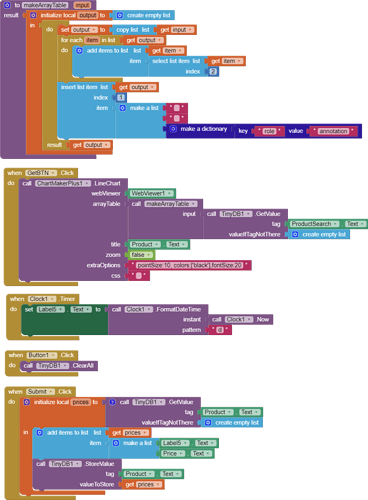
and how do i make the list of tiny db
in an array table?
OK, I guess an example will be forthcoming....
It doesn't work ![]()
are you clearing tinyDB before a new test?
yes
oh well I forgot to put a block
now it works perfectly
Thank you very much😁
I hope I don't encounter any more errors!.
thank you all.
Hi everyone, I wanted to know if it was possible to click on a value in the graph and say some more information about when that value was added.
Thanks
You can have a look through the configuration options for your chosen chart style to see what is available, but from what I can see it is not possible to display, on the chart/label/tooltip, anything other than the values you input for the chart.
What you could do is capture the data returned by selecting a chart item, then use that to select additional information stored in an AI2 list in the app, then display this in a label or perhaps a popup dialog.
ok thanks<3
The app is retrieving data from a firebase database and presenting it with a ChartmakerPlus line graph.
I would like to add a target line. Since the graph can be called to show 8 different group of data. So, I will need 8 different target lines.
I can add a sub-group of the database with each group's target or even hardcode the targets as constants.
I am thinking one possible method is to code a constant in a second column in the database?
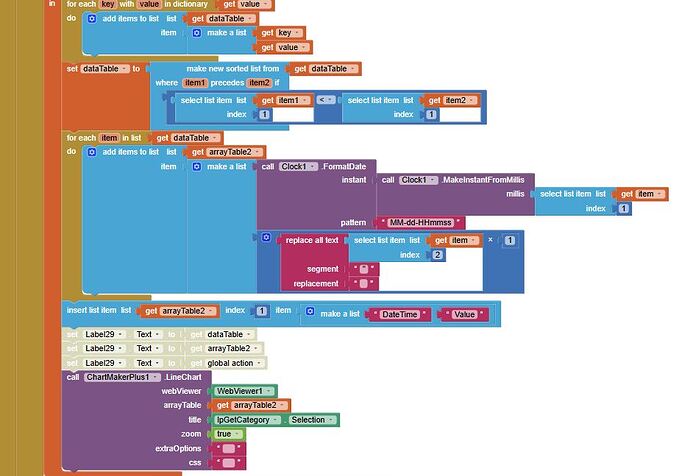
Attached is the blocks of creating the table that is passed to the ChartmakerPlus.
What am I making difficult?
Quickest/Easiest way to achieve this:
(using the example aia project I have provided)
Create a dictionary containing keys that match the tags in Firebase, and values for each target:
Add these to the arrayTable list for each row:
Add a header for Target:
aquariumFBwithChartTarget.aia (17.2 KB)
Thank you - they was exactly what I was trying to do.
I have the last piece. The middle piece is where I could not think of.
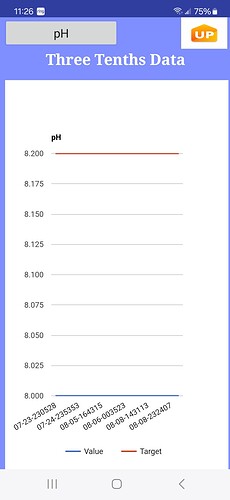
How can I control the X axis in the graph? For example, the pH graph the blue data line is at 8.0 and targetline is 8.2. Can I eliminate the .25 increments and keep it at tenths? can I start the X at 7.7 and have 7.7, 7.8, 7.9, up to 8.5?
The date/time across the bottom - I need to keep the seconds in the data for sorting, but would like to truncate down to just hours / minutes on the graph display as "07-23 24h05m"
