Did it work when you unticked screen scrollable ?
Dear TIMAI2.
I found the problem.
it's not android version problem.
you were right.
it's due to screen scroll function checked
some people used big font, so, the screen was scrolled.
I disabled the screen scroll function and then everything is ok.
Thanks for your kind support.
1 Like
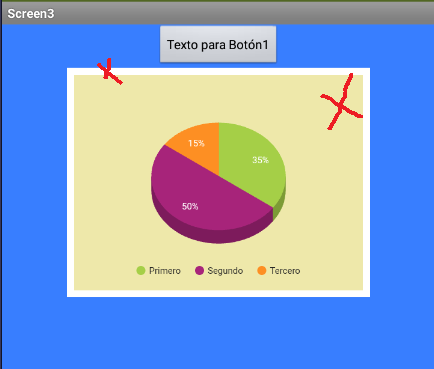
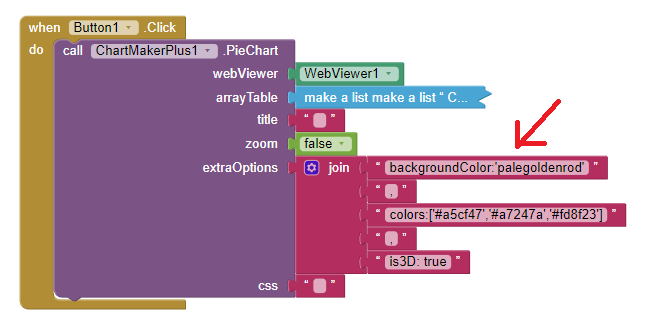
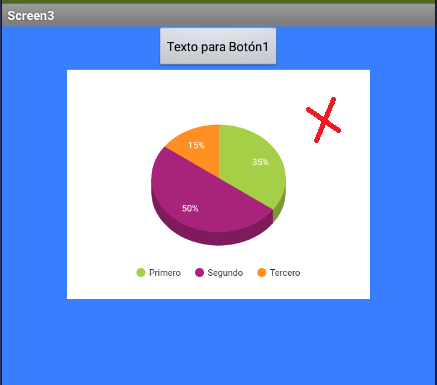
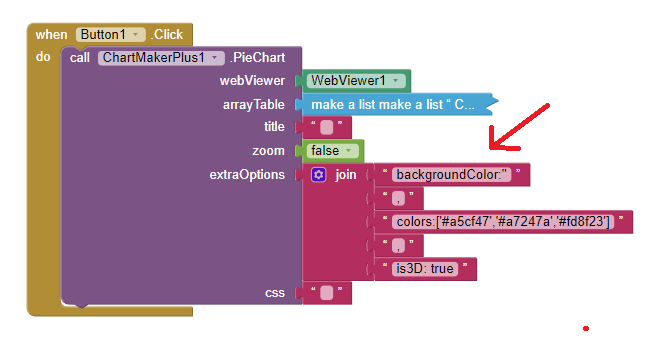
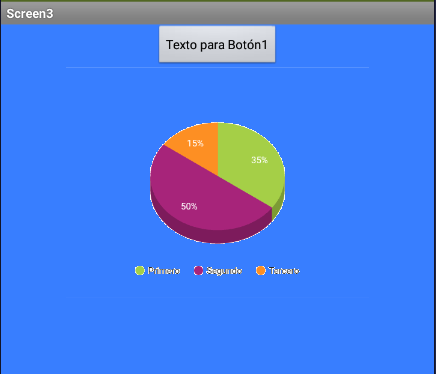
how can I remove the background color?
bottomless
Which one? Explain more on what you want to achieve.
Much of this already covered in the posts above, I would start reading from here:
If this is not what you want, come back.
If you want a transparent webviewer then you can use the webviewextra extension which provides that feature:
Look in the configuration options for the Pie Chart:
especially fontSize and legend.textStyle
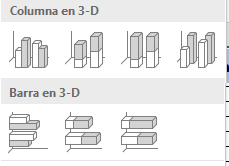
I have looked for information on 3D graphics and I have not found
only the 3D circular graphic method
I would like to get a 3D bar graph
some example?
No 3d option for anything other than the Pie Chart from what i can find in the documentation and on SO
consultation
Is there a possibility of being able to disable one of the lists?
I understand that lists necessarily have to have text
but in the event that we have not yet reached the month, there is no data to fill out
That is why I need to disable that list momentarily until the data for the month is filled out.
the tags
Plan_dic
Real_dIc
When we reach that month I automatically obtain the data from the FB and that list must be enabled
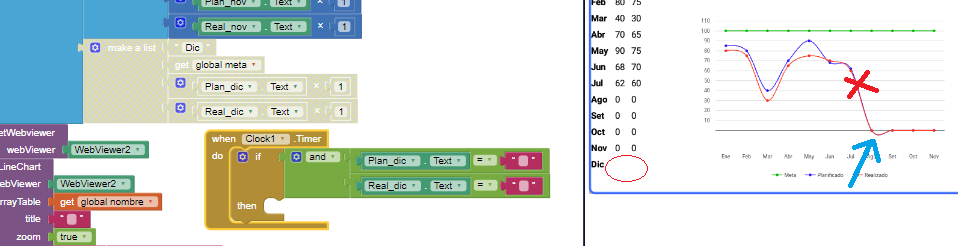
As you can see in the image, if we set 0, the curve is deformed and goes below the X axis.
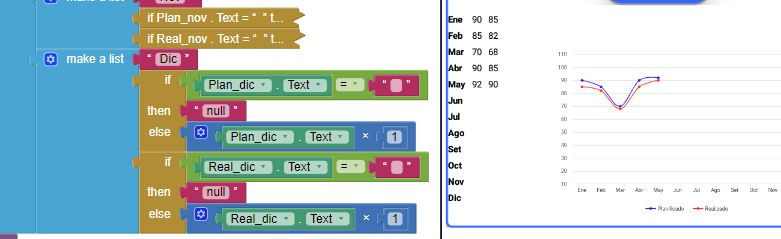
Try entering null for your months with no data
how would it be?
null is a block?
where do i find it
do you have any example?
No, null is a text (not zero or blank, but nothing), but google charts should see it as null
Try it with the example chart here:
https://developers.google.com/chart/interactive/docs/gallery/linechart#curving-the-lines
[ ['Year', 'Sales', 'Expenses'],
  ['2004',  1000,      400],
  ['2005',  1170,      460],
  ['2006',  660,       1120],
  ['2007',  null,      null]
 ]
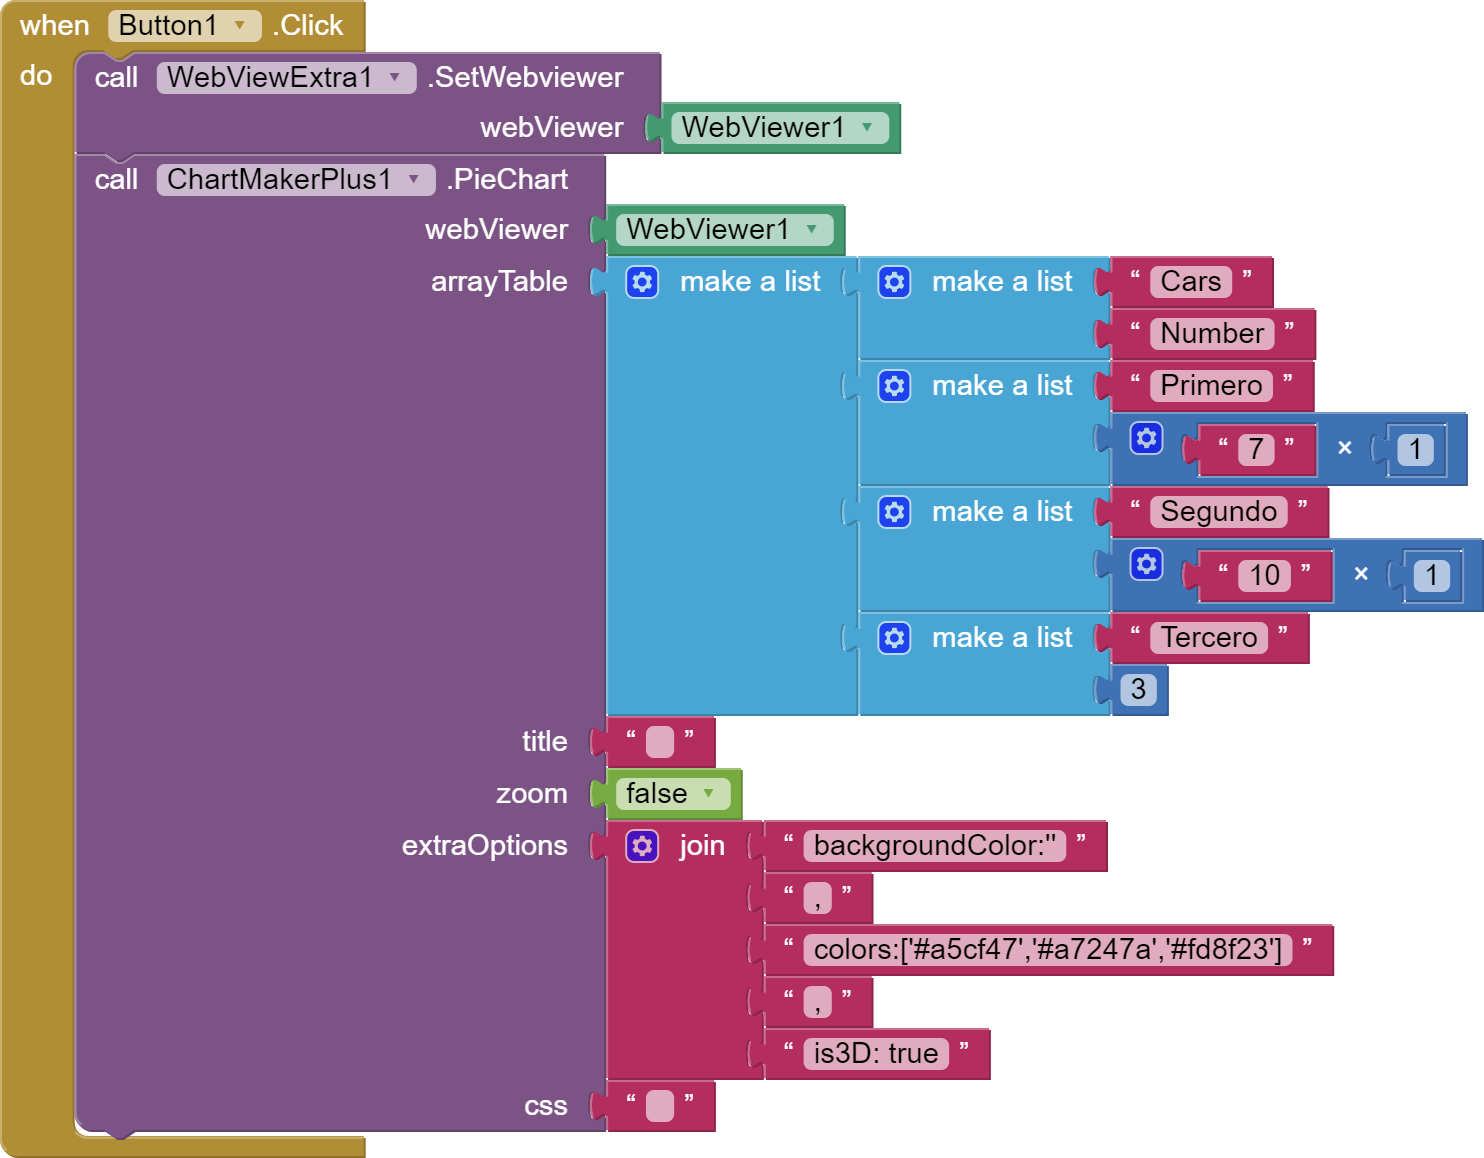
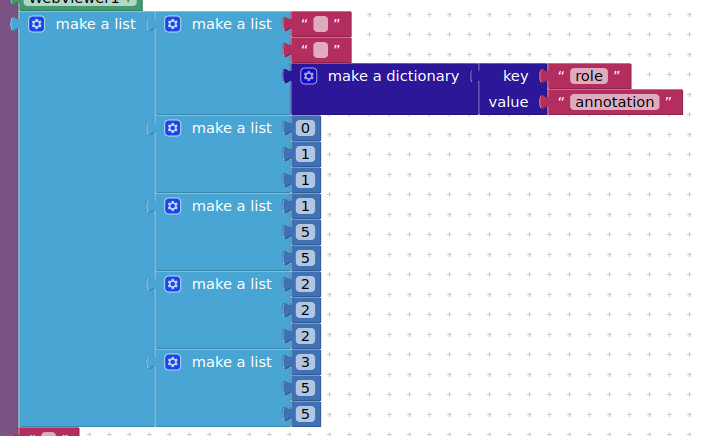
Hi everyone,
I was trying to use the ChartMaker plus extension
but when I click the button to view the graph I get an error
"Data column(s) for axis #0 cannot be of type string"
how can I solve it?
Thanks.
Pricetrend1 (1).aia (13.5 KB)
Look again at the example I gave you. You need to include header values for x/y, and more importantly the dictionary that will show the labels ! You also have to duplicate the second value for the label.
sorry but how do I do it with tiny db 1
Sorry for my ignorance but I don't understand much about it
You should be able to see what your "arrayTable" needs to look like, from my example. You will need to add the required items to your list coming from the tinydb so that it has the same format.
and how do i make the list of tiny db
in an array table?