Which graph do you want to display ?
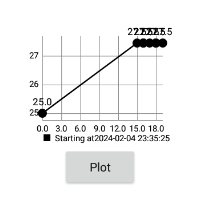
Line chart
At x = date_time
At y = temperature
Here's one using the AI2 charts component, which does not treat JSON the way I had thought when starting out>
Screen2 has the working sample, Screen1 my failed JSON DataFile attempt.

charts_JSON.aia (6.8 KB)
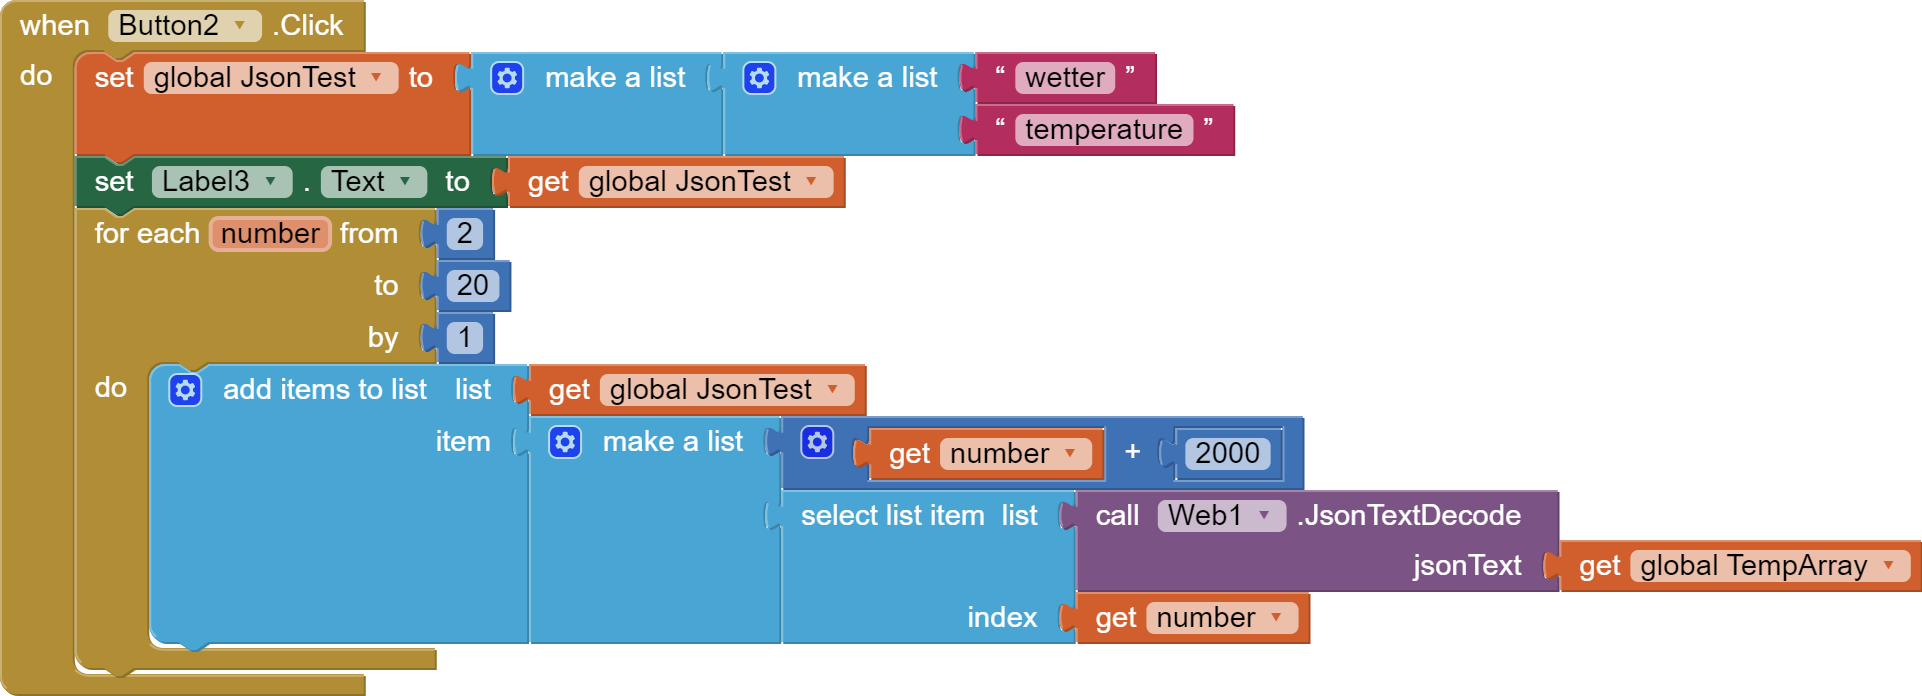
Most of the work is digesting the JSON and the timestamps.
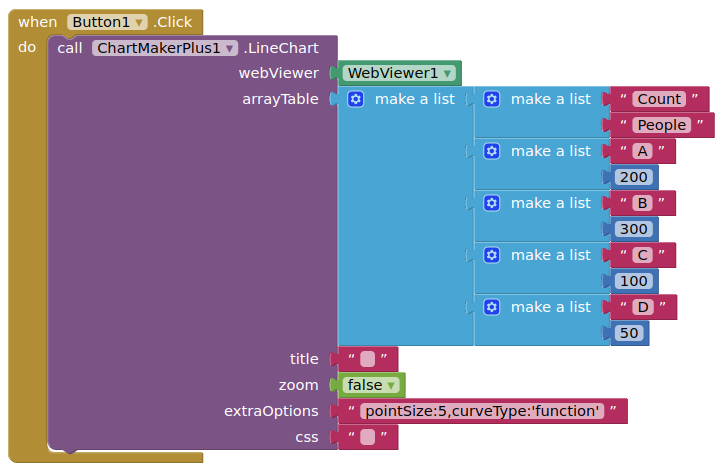
Given that your asked for a ChartMakerPlus answer:
BLOCKS


You can add more formatting layout options in extraOptions and css as required
Very nice extension!!!
i have a question.
How can I chage font size in the table?
I don't have any manual for extraoptinos.
I provided links in the first post for each chart type's configuration options.
If you are making a table chart then you use css to modify the display elements of your table.
Like so?

Hello Community How can I a Column from Google Sheet like
[People,200,300,100,50]
display with ChartMakerPlus
What type of chart do your want to make ?
At the very minimum you are going to need a header row:
[
["People","A","B","C","D"],
["Count" ,200,300,100,50]
]
it works well, Thank you very much.
I have question about table again.
I want first line to be fixed without any change when I scroll up/down screen.
When I scroll, first line text is not moving, but, background color is changed in to transparent color. so, first line and other line characters are mixed.
Is there any option?


Oh Sorry I forget It should be a line diagram
You will need to look through the configuration options here and do some internet searching on how to configure the header row so that it behaves itself.
If I get time I will also see what I can find.
THx TIMA12 But this is easy but Danke
After fiddling for Hours I Got it
On Google Sheet you have to Change it to US behause in Germany we have a different Notation 12,566: You Change this
Set a spreadsheet's location & calculation settings
- On your computer, open a spreadsheet in Google Sheets.
- Click File. Settings.
- Under "General," click the "Locale" and "Time zone" menus to change your settings.
- Click Save settings.
Thank you for this Tool
Thank you very much.
I'm not familiar with google chart and I tried to find the way.
But, I couldn't find.
Please, Help ^.^
@jnstyle0
I will see what I can do.
In the meantime, it may be easier to use the Tableviewer extension ?