📊 [Free] ChartMakerPlus - an extension to make google charts

Hi
Good extension
Is there a way to keep for instance One Hour of data ? Or let's say 150 dots

thx

What do you mean by "keep" ?

Do you mean to store a specific set of data?

Trim the incoming data list, regardless of choice of graph package:

do while length of list (L) > 150
remove item 1 from list L
end do while
reload graph

Hi! i'm using your extension and it looks very useful, i have a little problem with my container and zoom and i can't get rid of this.
If there is no zoom the chart looks like this

but when an user want to zoom in, the webviewer don't allow that and the result is a truncate image

i've tried with overflow: scroll in the css menù but i'm pretty sure i miss the class of css item, can you give me some tips?
Thank You
Luca

Looks like it is zooming OK to me The zoom feature zooms the entire html page.

Show your blocks for the chart....

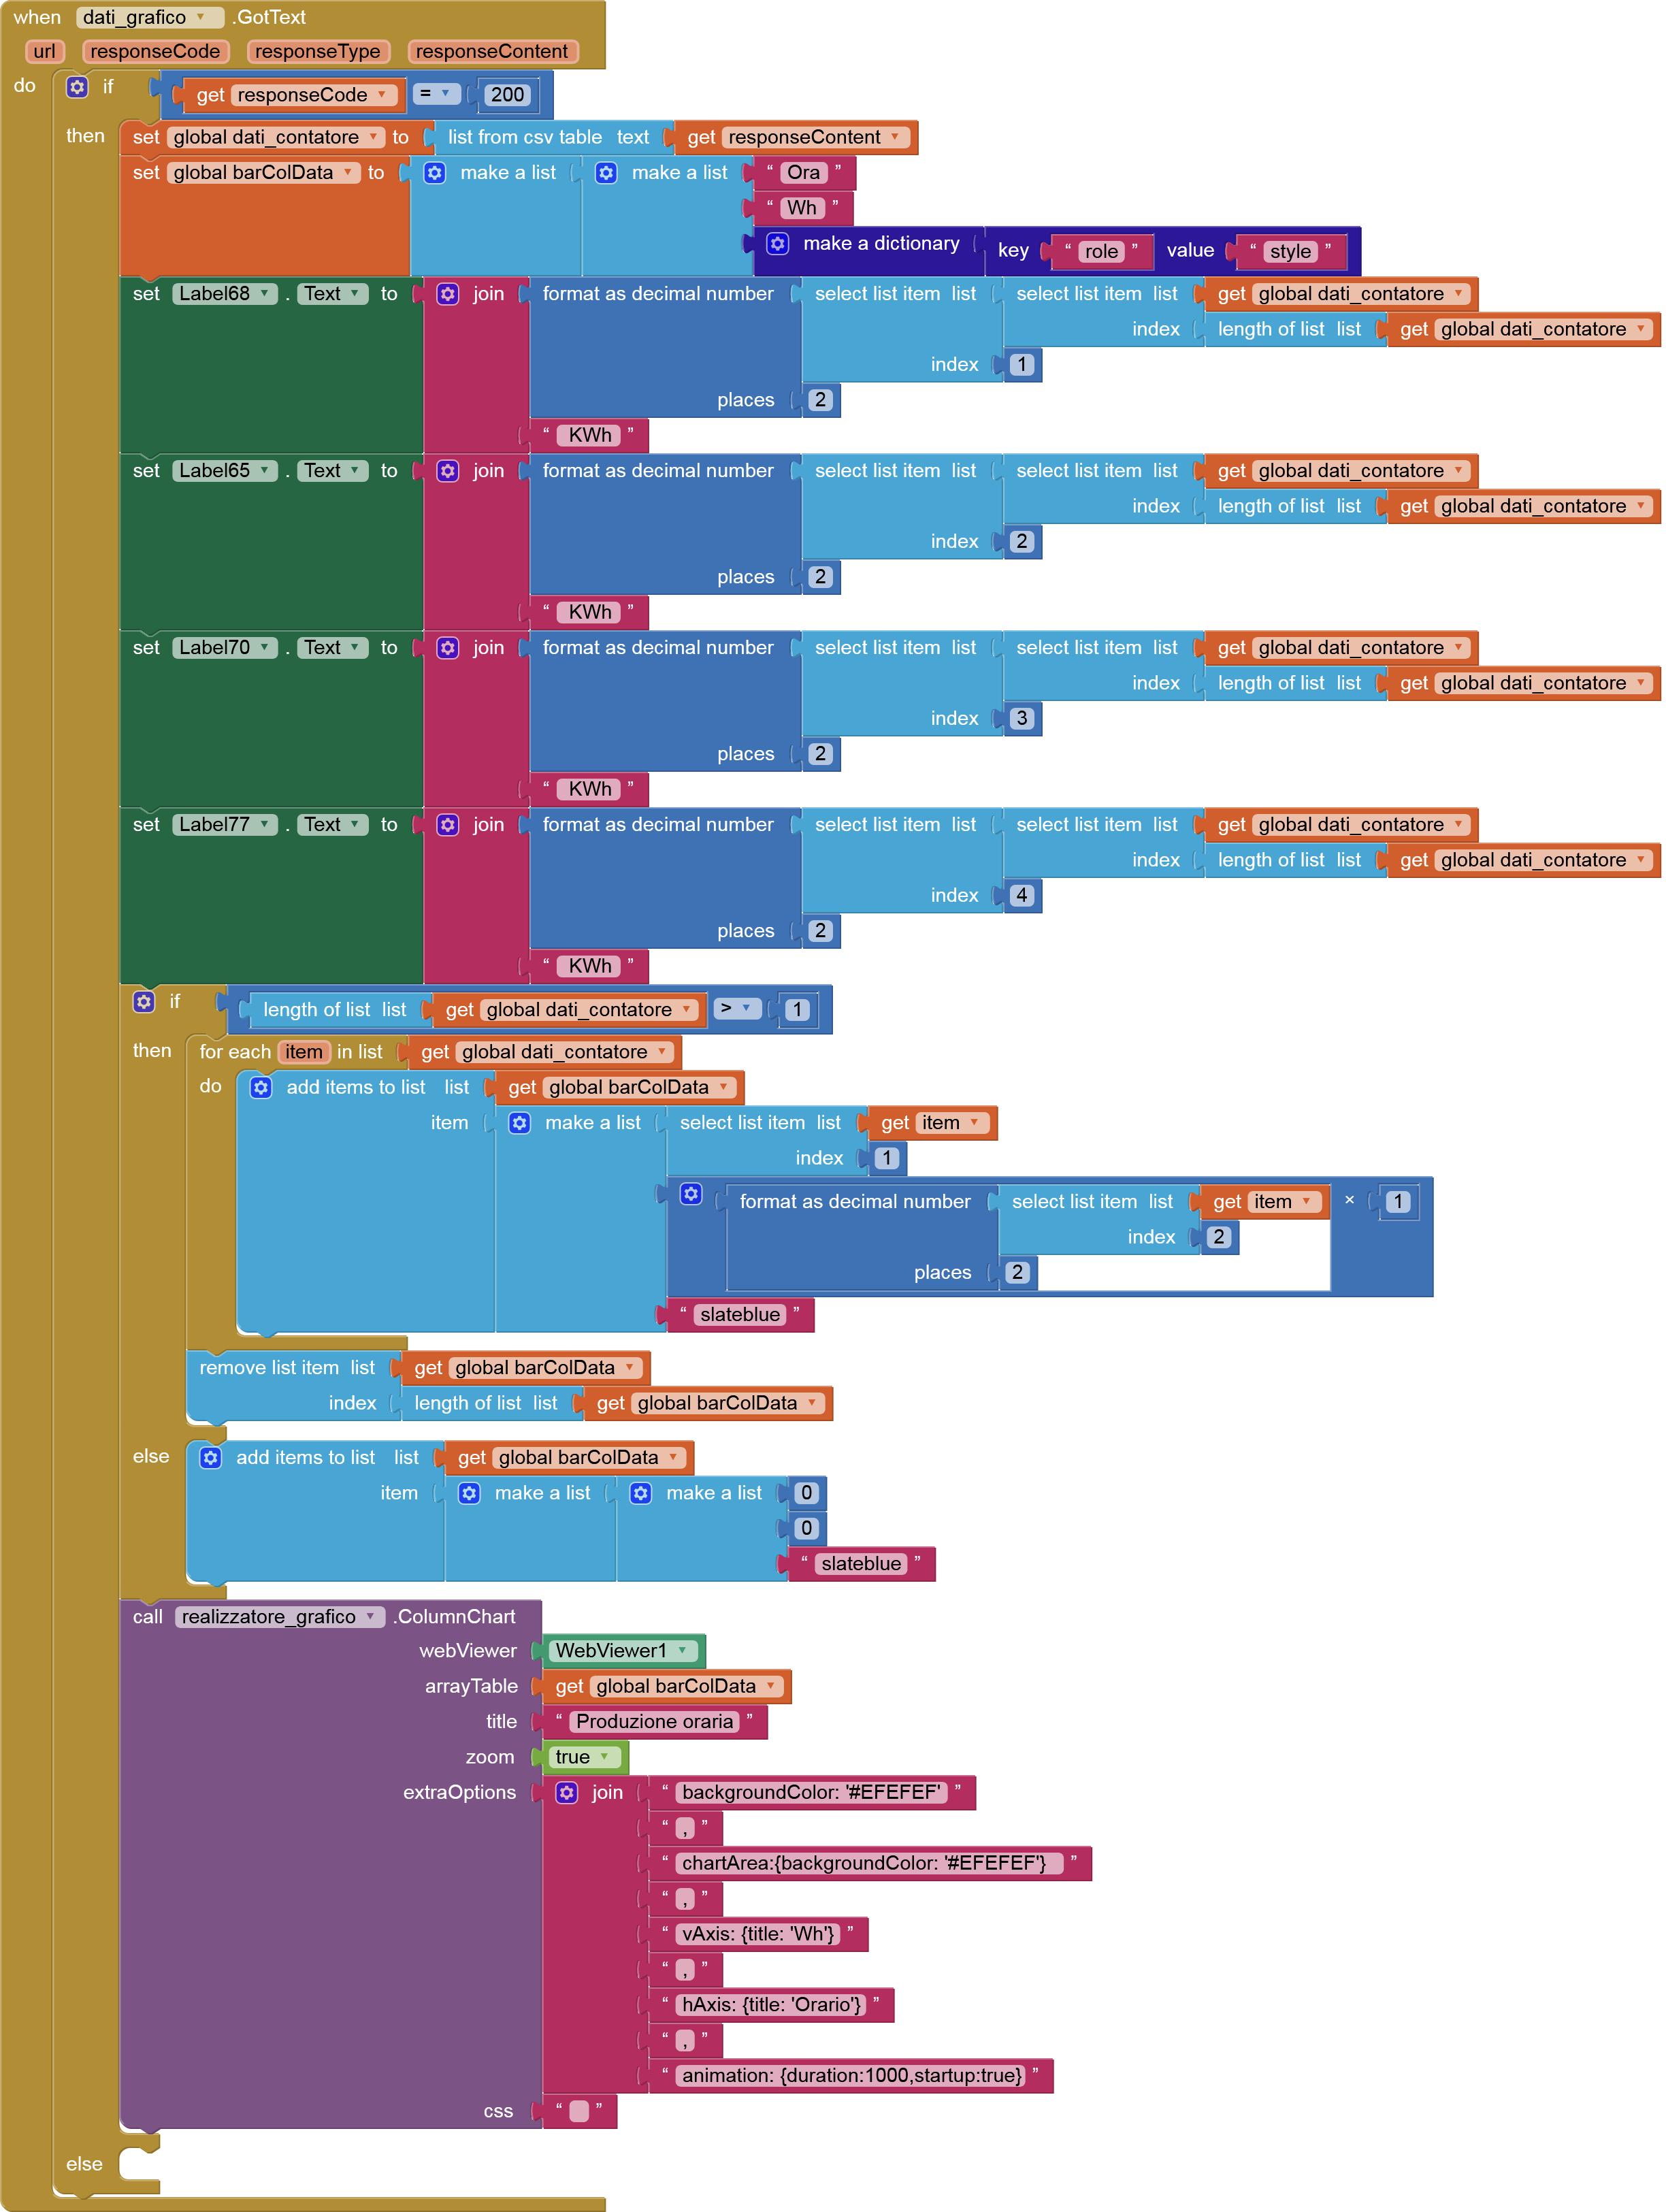
Sorry i exposed the problem in a confused way.
It does the zoom but the container doesen't allow me to scroll in the zoommed page, the result is that the content i want to zoom result truncated.
this is the block

I would have to build up an example chart to test this out.

You could try adjusting the chart size using css. The chart is in a div with id = col_chart set in the extension width = 100% and height = 100%. Change these to pixels instead of percentages...

<body>
<div id="col_chart"  style="width:100%; height:100%;"></div>
</body>
1 Like

Sorry but i didn't understand were and how i have to change the pixels instead of percentage :cry:
I tried to build an app with the graph only, the WebViewer show data and i can move in the zoomed window normally.
In my application there is a big vertical scroll arrangement (width and height set to "fill parent") , inside of it there is a block with some data and, below that, my graph, but in this case the window is blocked.
if i set automatic size in a blank project, it work fine, but if set that in my project, graph don't even show, i have to set a fixed height to make it visible.

I have just tested the demo aia project from the first post in this topic, on the column chart with zoom set to true. Using companion app, the graph zooms with a two finger gesture, and scrolls around with a one finger gesture. Therefore unsure as to where your issue lies?

I found the issue, if you have the webviewer in a container, and the sum of the container height is over 100% (in my case the first box have height 70% and graph 50%, scrollable), the movement inside the zoommed graph is blocked.
i hope this video describes well the error

OK, scrolling within a scrolling arrangement. Yep, doesn't always work.

You could try this extension:

to split up your big scrolling arrangement into pages.....

Thank you so much :heart:, i'll try it out!

Best regards
Luca

Hi! first of all i speak spanish, so i apologize if my english is not good enough. I tried to make a column chart with data from firebase, but it doesn't seems to work, i swear i read all the documentation and try by myself but honestly i can't. i know my database is setted correctly. My problems are only the blocks. i just need to do a column chart with 4 columns that updates when i touch a button, and it should display the 4 int values into the columns, i know my problem is in the "list" part but i tried so many ways, so i return to the begining for this question, what should i do from this cap to do what i want? sorry if i am asking you something stupid. i need to siplay in the columns the first 4 tags from firebase, and keep it updated when i touched a button.


firebase

Let us simplify to start off with. Based upon your displayed firebase data, your columnData should look like this:

image

image

If you apply this, do you get your column chart ?

image

If so you need to show how you are returning the firebase data to the app, and in what format.

I started from the base y gave you in the first 2 pics to simplify the help you can bring me, so the first 2 pics i brought you is all i have, now i copy your pics exactly the same and i got the same pic you posted Also i don't have the "firebase blocks" because i thought it was extremely wrong so i delete that. i have my token and my firebase link correctly setted in the "designer" part, i know it because i can send int data from app inventor to firebase.
Edit: thanks for your soon reply.

Hi ! Me again, i tried my best but i still struggling with this, i came to an old post in this thread, and i intend to copy that, so this is the best i´ve got, but still not working, first pic it´s my blocks, second the image i tried to copy (this image it´s in some point in this thread). i hope someone can help me, thanks again. also i know my blocks are extremely wrong.


This:

is all a terrible muddle

You need to build your columnChart in the Firebase.GotValue event

sorry for that. It would be under the set "global plato" event, right? doing that, my chart doesn´t show any number in the "AguaGrande" column, it´s only an empty column. So with that modification, this is what i have.

So what value is in your tag ComidaGrande? Set the value to a label so you can see it, or check your firebase data.

In firebase, the tag "ComidaGrande" is 20, but in my chart seems to be 0, is an empty column. i´m thinking if could be a problem with the way i call the tag i the "call firebase. get value" event, is it okey to write it in that way ? or should i write a slash o something like "/ComidaGrande"