What happens when you repeat the valor2 as indicated in the image?

What happens when you repeat the valor2 as indicated in the image?

when i use DynamicGraph2 >> no issue except i have to kepp bith val1,val2 at same min/max . (my val1 max is 1000 while val2 max is 25) >> i have to map it to read it on graph but no lag issue.
fyi i am plotting ECG like - so Esp32 sents every 100 ms and mitapp clock at 75 ms
How does the ESP32 send the information, by classic Bluetooth, by BLE, by FireBase, by WiFi?
by classic Bluetooth
mit app: clock >> 120 ms
dynamic.graph resolution > 10 ms
Bluetooth pooling rate >> 10 ms
esp32 to bluetooth 200 ms
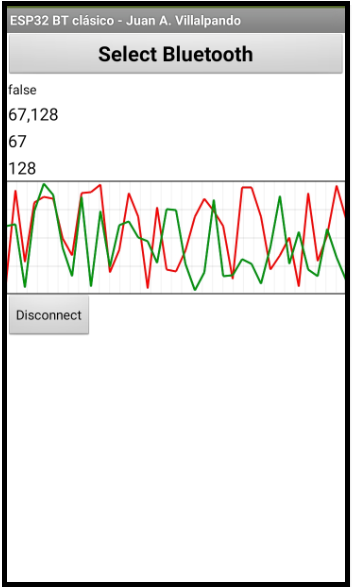
Here an example with ESP32 and classic Bluetooth.
4.- ESP32 sends by classic Bluetooth, two random numbers to the app, they are displayed in a graph.
thank you ,
this is what i am at now already ..
I have added the block with two graphics.
http://kio4.com/appinventor/299H_extension_GraficoDinamico.htm
you are as awesome as usual ..
fyi , no lagging or cutting and pausing in my graph anymore with 2 var extension. be blessed 
your HELP is needed please.
thank you so much ..
Set another Clock.
Hi, this is brilliant, but is there any way to plot the values of multiple potentiometers using Bluetooth?
That's very helpful thank you! I also have another question. I was hoping to find the peak value of the graph drawn, however, the get max value block seems to only print the upper range of the graph and not the peak of the graph produced. Is there a way to get the peak value? Thank you
If you want to get the maximum value returned, you should create a code for it. The MaxValue block displays the maximum value configured on the chart.
Here's how to capture max(y values) from a list of (x,y) pairs.
If you only save y values, just use the max in list block.
Hi,
Thank you for replying. This looks like its an imported list however, and its picking out the larges value from pairs of values. I think I'm looking for something more dynamic as I am streaming in data. I wanted to compare the max value to the incoming value, so if the max value is smaller than the incoming streamed value then it would update to the new value, but if it is less, it would remain at the maximum value.
I was using the if/then blocks and managed to get the max value to update with the streamed in data, but I'm having trouble keeping the max value the same if the stream data is less than the max value (the max value increases and decreases with the streamed values).
Thank you

Say you want the running maximum of global Y.
Init a global maxY to hold it, initially some low number like 0.
Each time a new Y value arrives, set maxY to max(Y,maxY).
Worked like a charm, thank you
Hi,
Great Extension
Is it possible to add legend and value on the x-axis and on the y-axis ?
Thx