[Extension] Dynamic graph. Shift left graph. Sinusoidal wave. Bluetooth

4 ms is too fast, try with a basic app modifying delay, interval and resolution values.

pA0_Bluetooth_Arduino_envia_Grafico.aia (16.9 KB)

float a = 0.0;
float b = 50.0;
String a_b;

void setup() {
  Serial.begin(9600);
}

void loop() {
  a = a + 1.0;
  b = b + 1.0;
  if (a >= 100){a = 0;};
  if (b >= 80){b = 50;};
 
  a_b = String(a, 1) + "," + String(b, 1);
  Serial.println(a_b);
  delay(4);
}

Try

Could you modify your app for Arduino nano33 IOT?

I don't have an Ardunio Nano 33, to do tests.
In this Community there is information about this type of Arduino.

https://community.appinventor.mit.edu/search?q=Arduino%20nano%2033

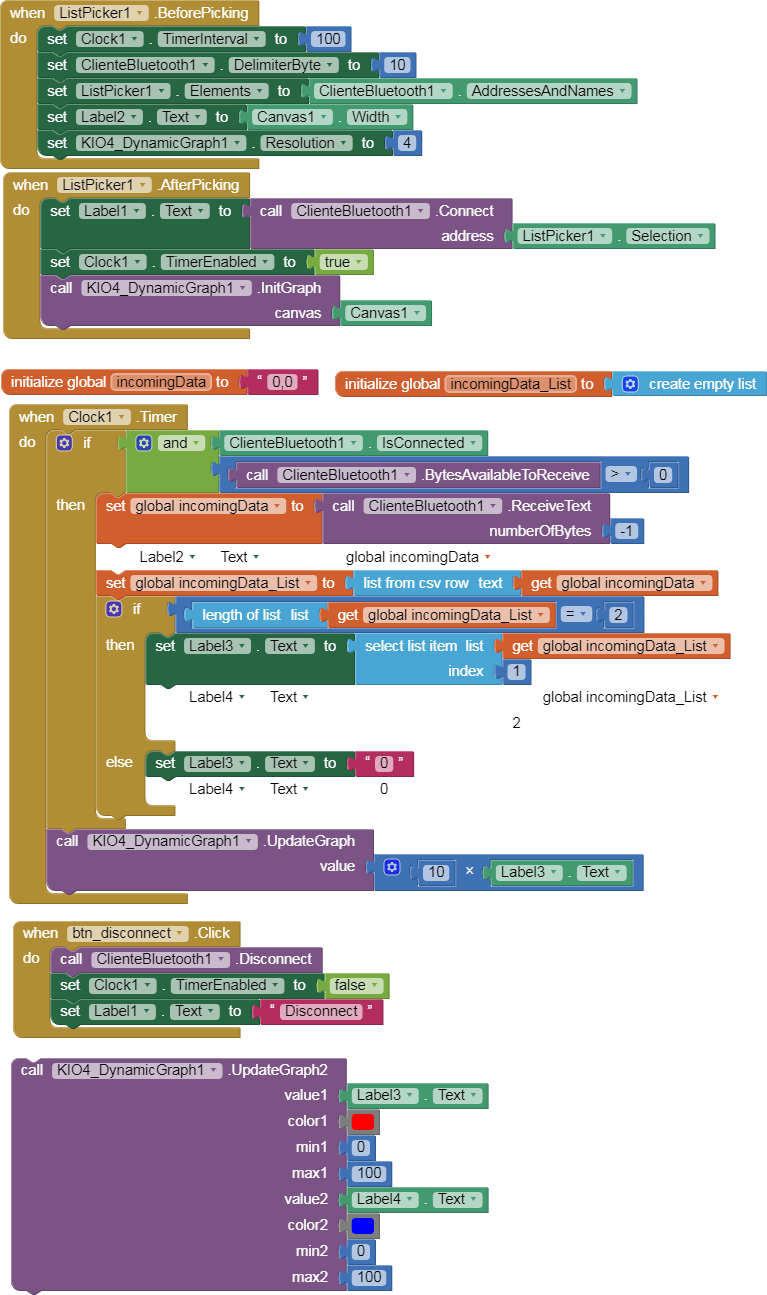
I think the best option is that you learn to send random numbers from Arduino to the application, and observe those numbers in a Label, when you get it you can use the Chart component or the extension to display it graphically.

Remember that you must set Bluetooth permissions in the new Android.

https://community.appinventor.mit.edu/t/runtime-error-need-android-permission-on-bluetooth-scan-permission/86338/3

1 Like

Hola Juan, ¡muchas gracias por tu trabajo!

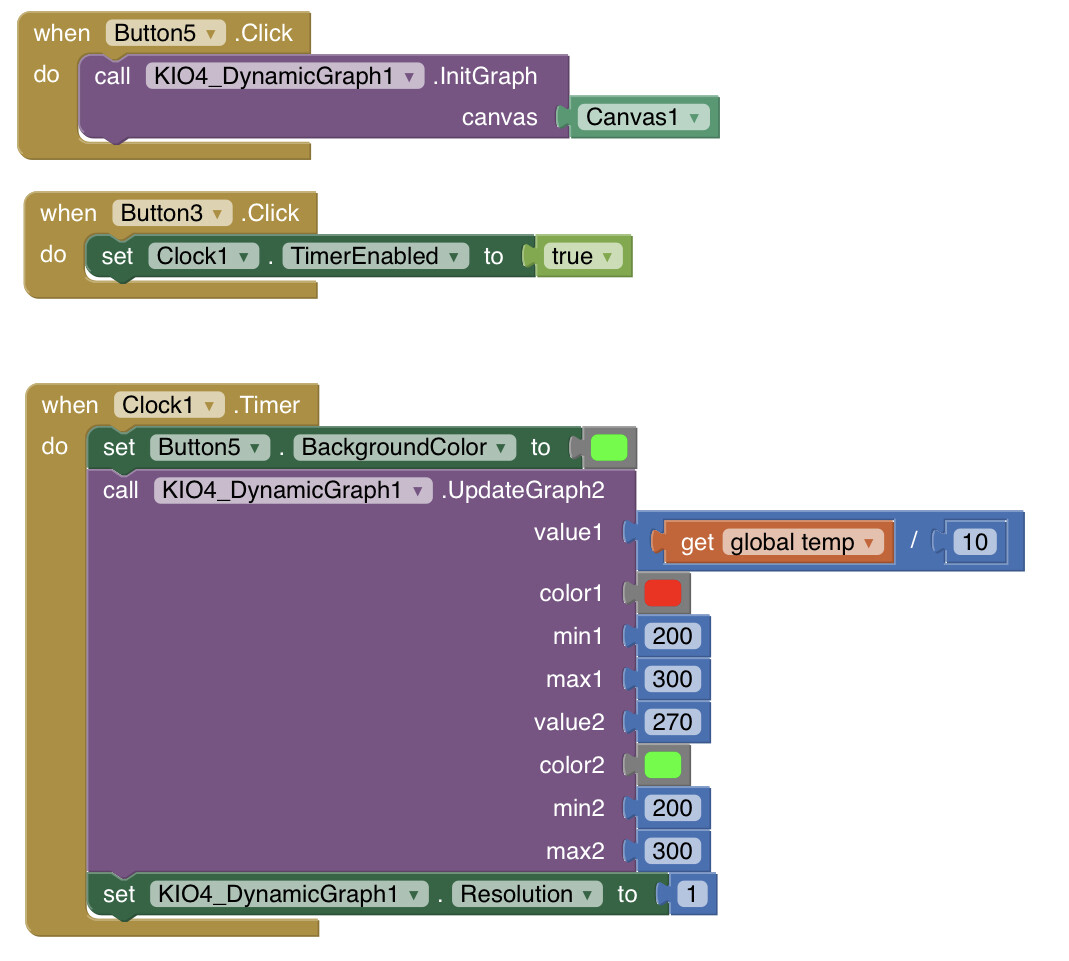
I am working in a graph generated by data from a temperature sensor via BLE.
I would like to have historical data of around 4min shown. I have tried lowering the resolution to 1, setting the clock to 500 milliseconds (rate I am interested in). With this configuration, the graph doesn’t fill the width of the screen (even if canvas width is set to fill parent).

I have tried to increase the width of the graph to 4000 pixels and it works in one phone but in another not.

How would you recommend to increase the historical data?