Dynamic graph. Sinusoidal wave. Shift left graph

Hello friends,

in this post we have a code to draw a dynamic graph:
https://groups.google.com/forum/#!category-topic/mitappinventortest/general-questions-about-app-inventor-programming/fNQVDN-GPIY
142w

I used that code to display a graphic in an application with Arduino and Bluetooth.
https://groups.google.com/forum/#!searchin/mitappinventortest/dynamic$20graph|sort:date/mitappinventortest/q-DGa_PVo_o/9yW89uL-BwAJ

Now I have simplified the code and show several examples:

1.- Create random numbers and draw a dynamic graph with their values.
grafico2
p91C_grafico_aleatorio.aia (7.4 KB)

2.- Draw the graph of a sinusoidal function.
grafico5
p91C_grafico_sinusoidal.aia (7.7 KB)

3.- In this voltage inverter amplifier we apply an input voltage Vi = 5 mV. The Gain is -15, so its output Vo = -75 mV


p91C_grafico_amplificador.aia (24.8 KB)

4.- We can study the damped oscillator equation.

grafico11
p91C_grafico_amortiguacion.aia (8.9 KB)

Regards.
http://kio4.com/appinventor/91C_grafico_dinamico.htm

14 Likes

Muchas gracias!

2 Likes

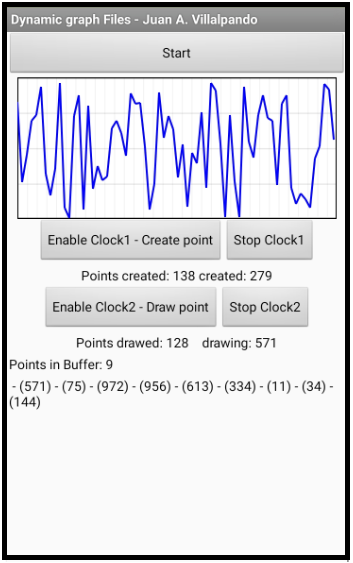
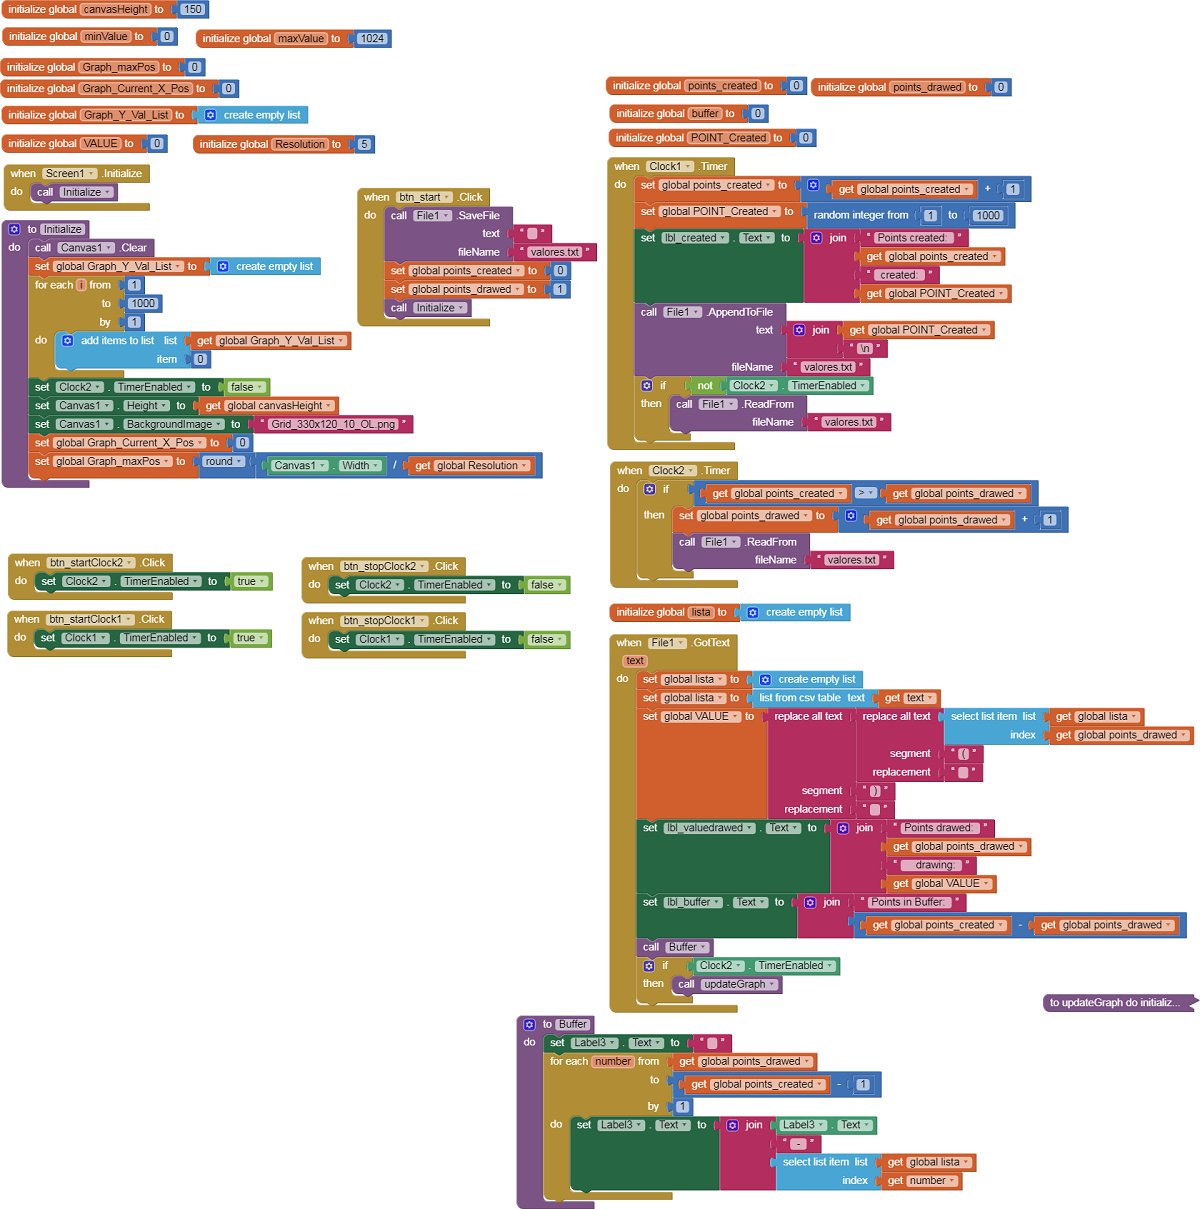
5.- Clock1 "fast" create point. Clock2 "slow" draw point.

p9BB2_grafico_dinamico_archivos.aia (10.8 KB)

  • Clock1.TimeInterval: 400 ("fast") create random numbers (1...1000) and AppendToFile: valores.txt

  • Clock2.TimerInterval: 500 ("slow"), gets the numbers from the file and draws them on a dynamic graph.

  • As Clock2 is slower than Clock1, a buffer of numbers pending drawing is observed.

  • You can enable or disable Clocks to see the effect.

  • Use the procedure: updateGraph

3 Likes

(added to FAQ)

1 Like