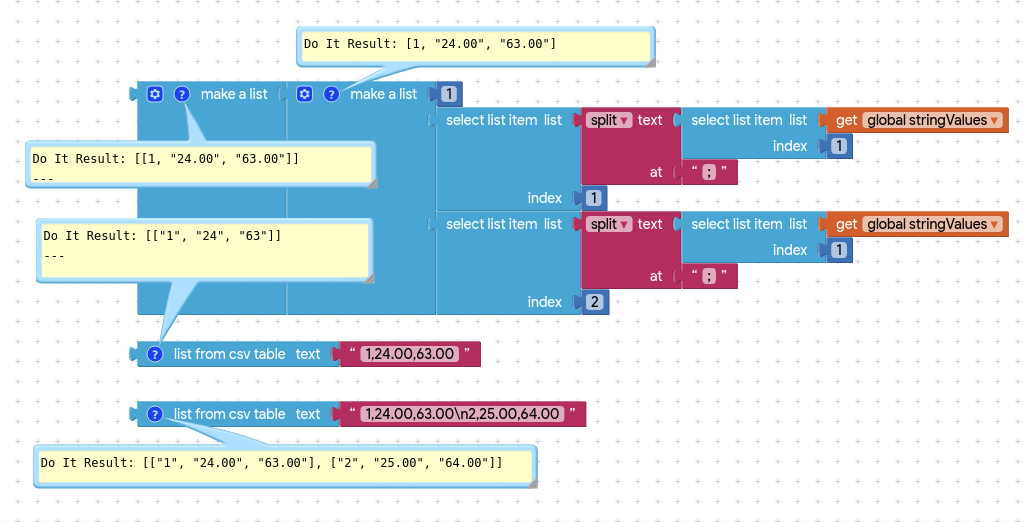
I just had a try,
it is not working because you endup with a list which look like this (according to ListView)
a1
b1
c1
a2
b2
c2
....
instead of looking like :
a1 b1 c1
a2 b2 c2
...
To be honest I do not understand really why I need to do twice the "make a list" but TIMAI2 (or you) may have an explanation
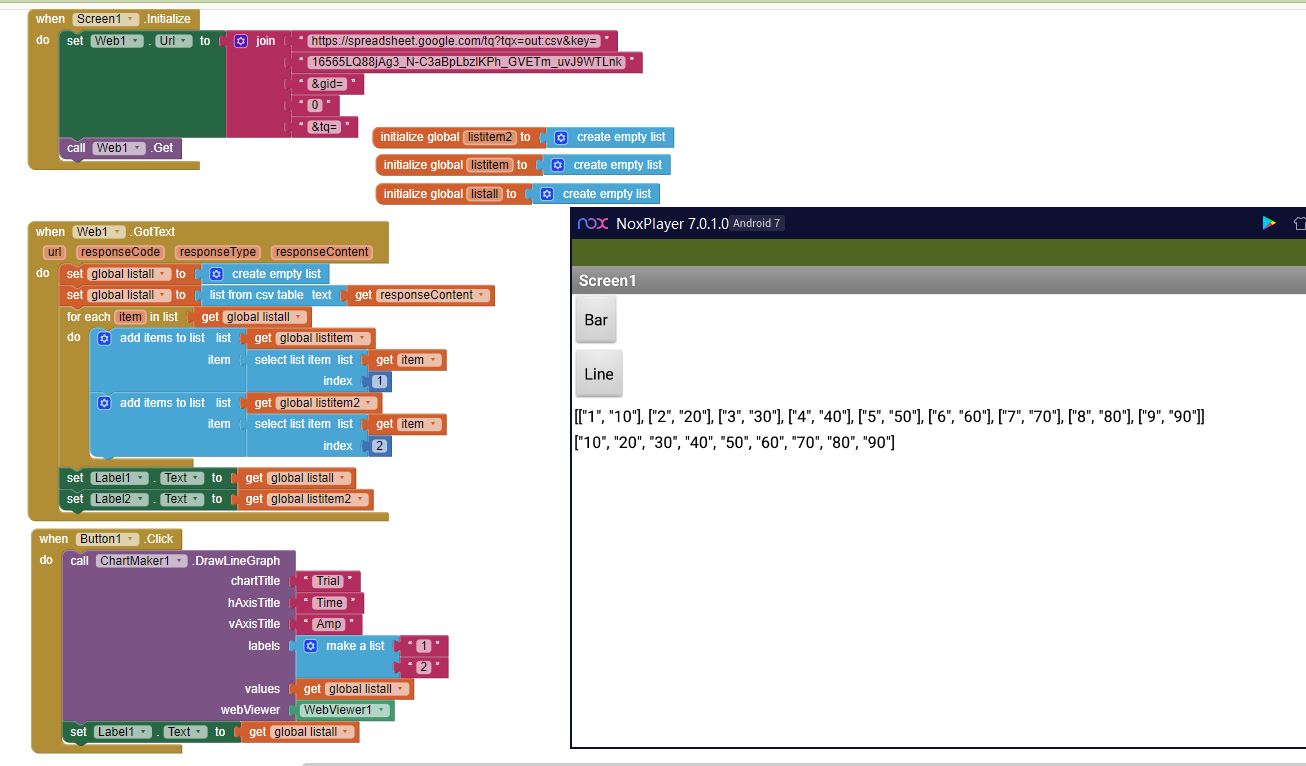
An additional question on the chartmaker extension:
let's consider we have a list of list with severals columns (more than 2), and plenty rows, as we managed to get in the previous discussion:
is there a possibility to just choose to display only 1 column? (instead of having all of them displayed?). In other word may I choose to display in chartmaker a specific dataset only?
In the applied example below I display automatically both "temperature" and "humidity", but I don t want to display humidity anymore. How I can handle that in the "values" ?
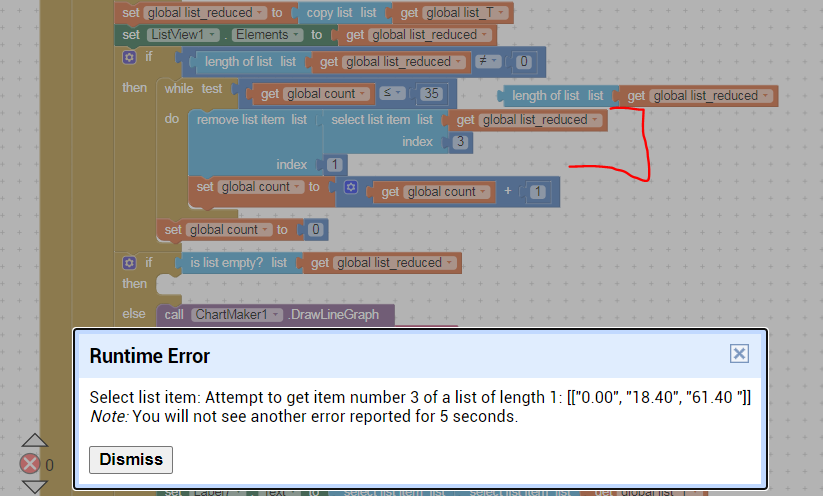
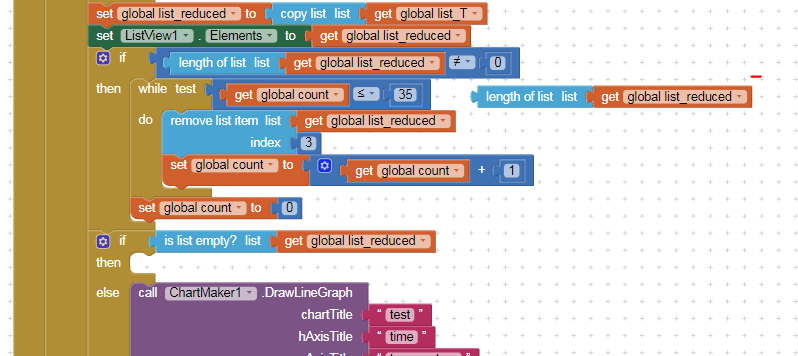
I m looking to remove a full entire column in on of my list so I can plot it using chartmaker extension (it s a work around since I m not sure we can select the data we want to display -> it s on discussion in another topic).
My current list is looking like this (when I see it on list view):
0,21,68
1,22,65
2,21,62
3,25,62
...
and I would like to get:
0,21
1,22
2,21
3,25
...
So first I did copy the list and try to remove the column 3 by implementing a loop with a while


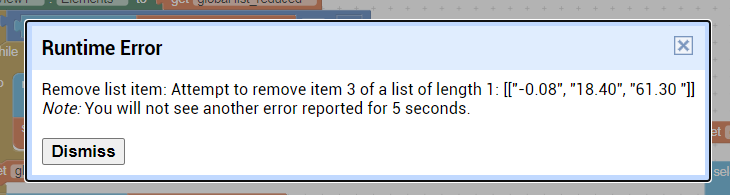
 !
!