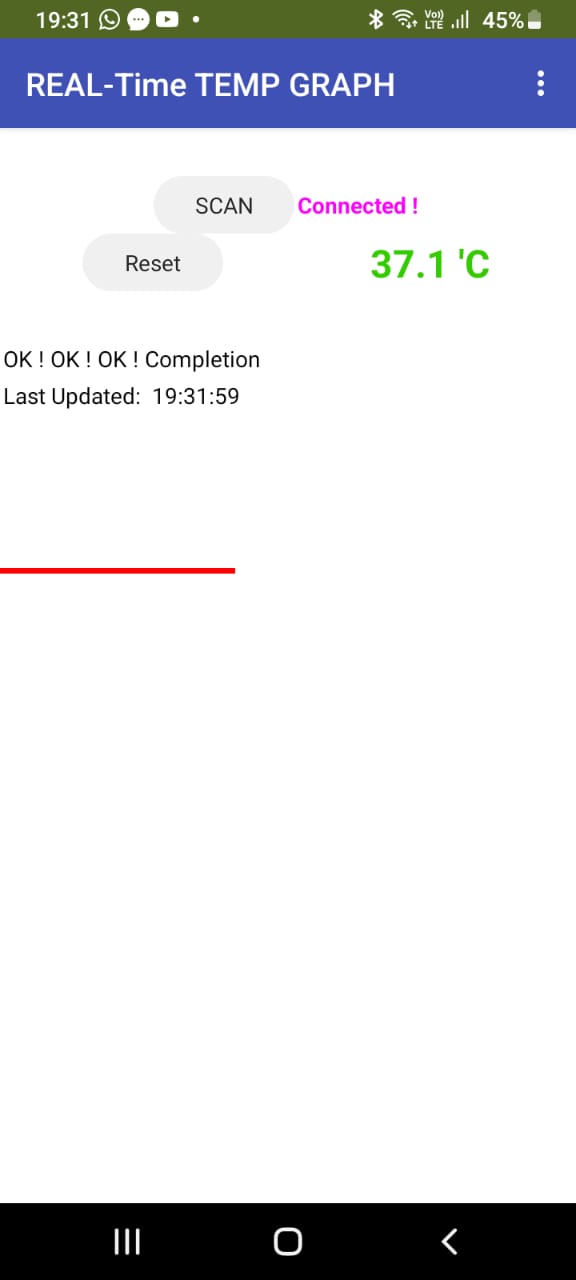
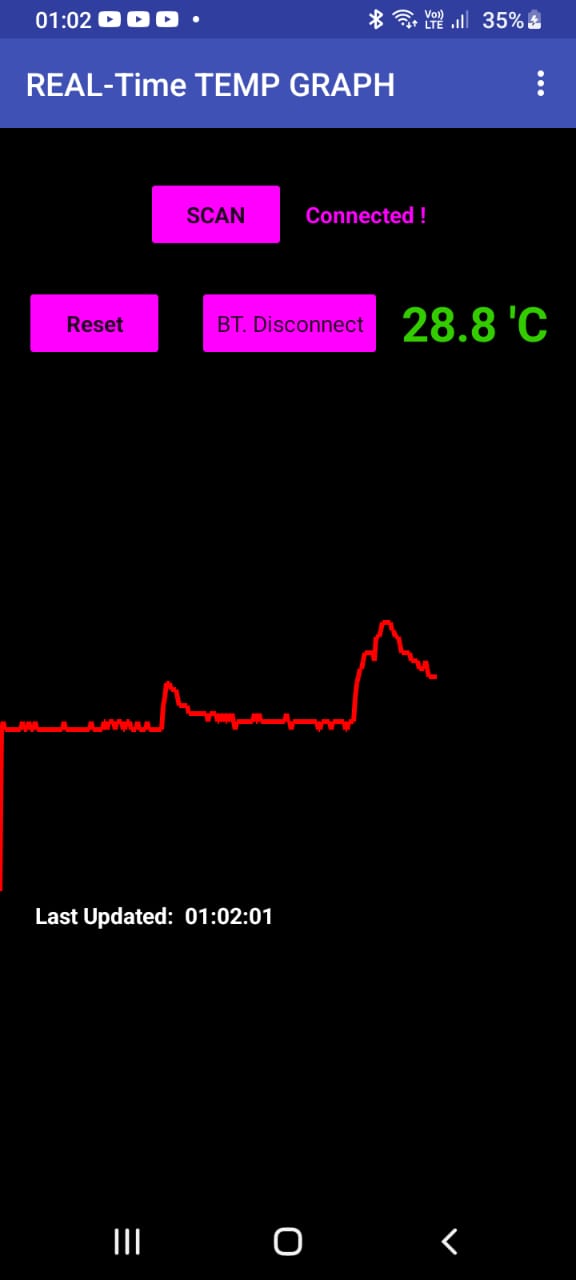
Hello, I have finished coding and the program runs well as indicated by the strategically-set labels I have set, but no graph is being plotted. I need help on how ensure its plotted. Thank you.
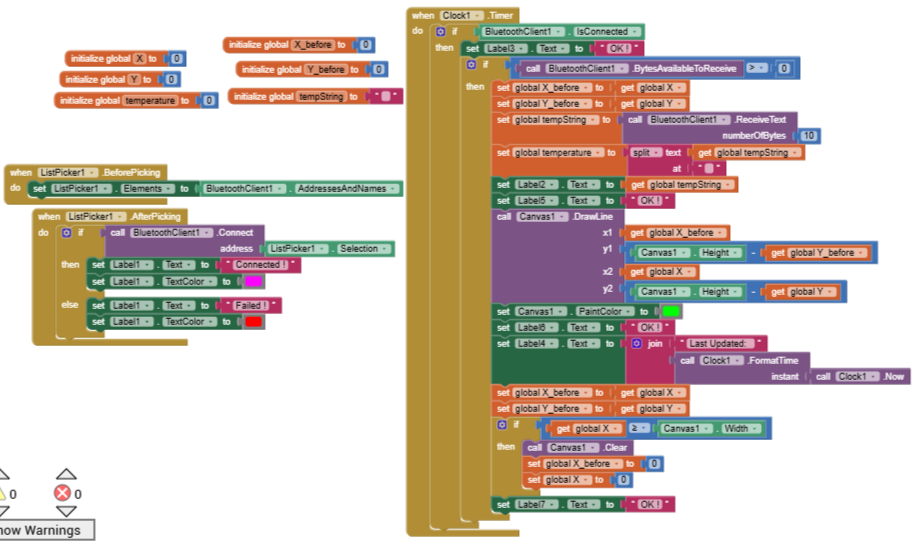
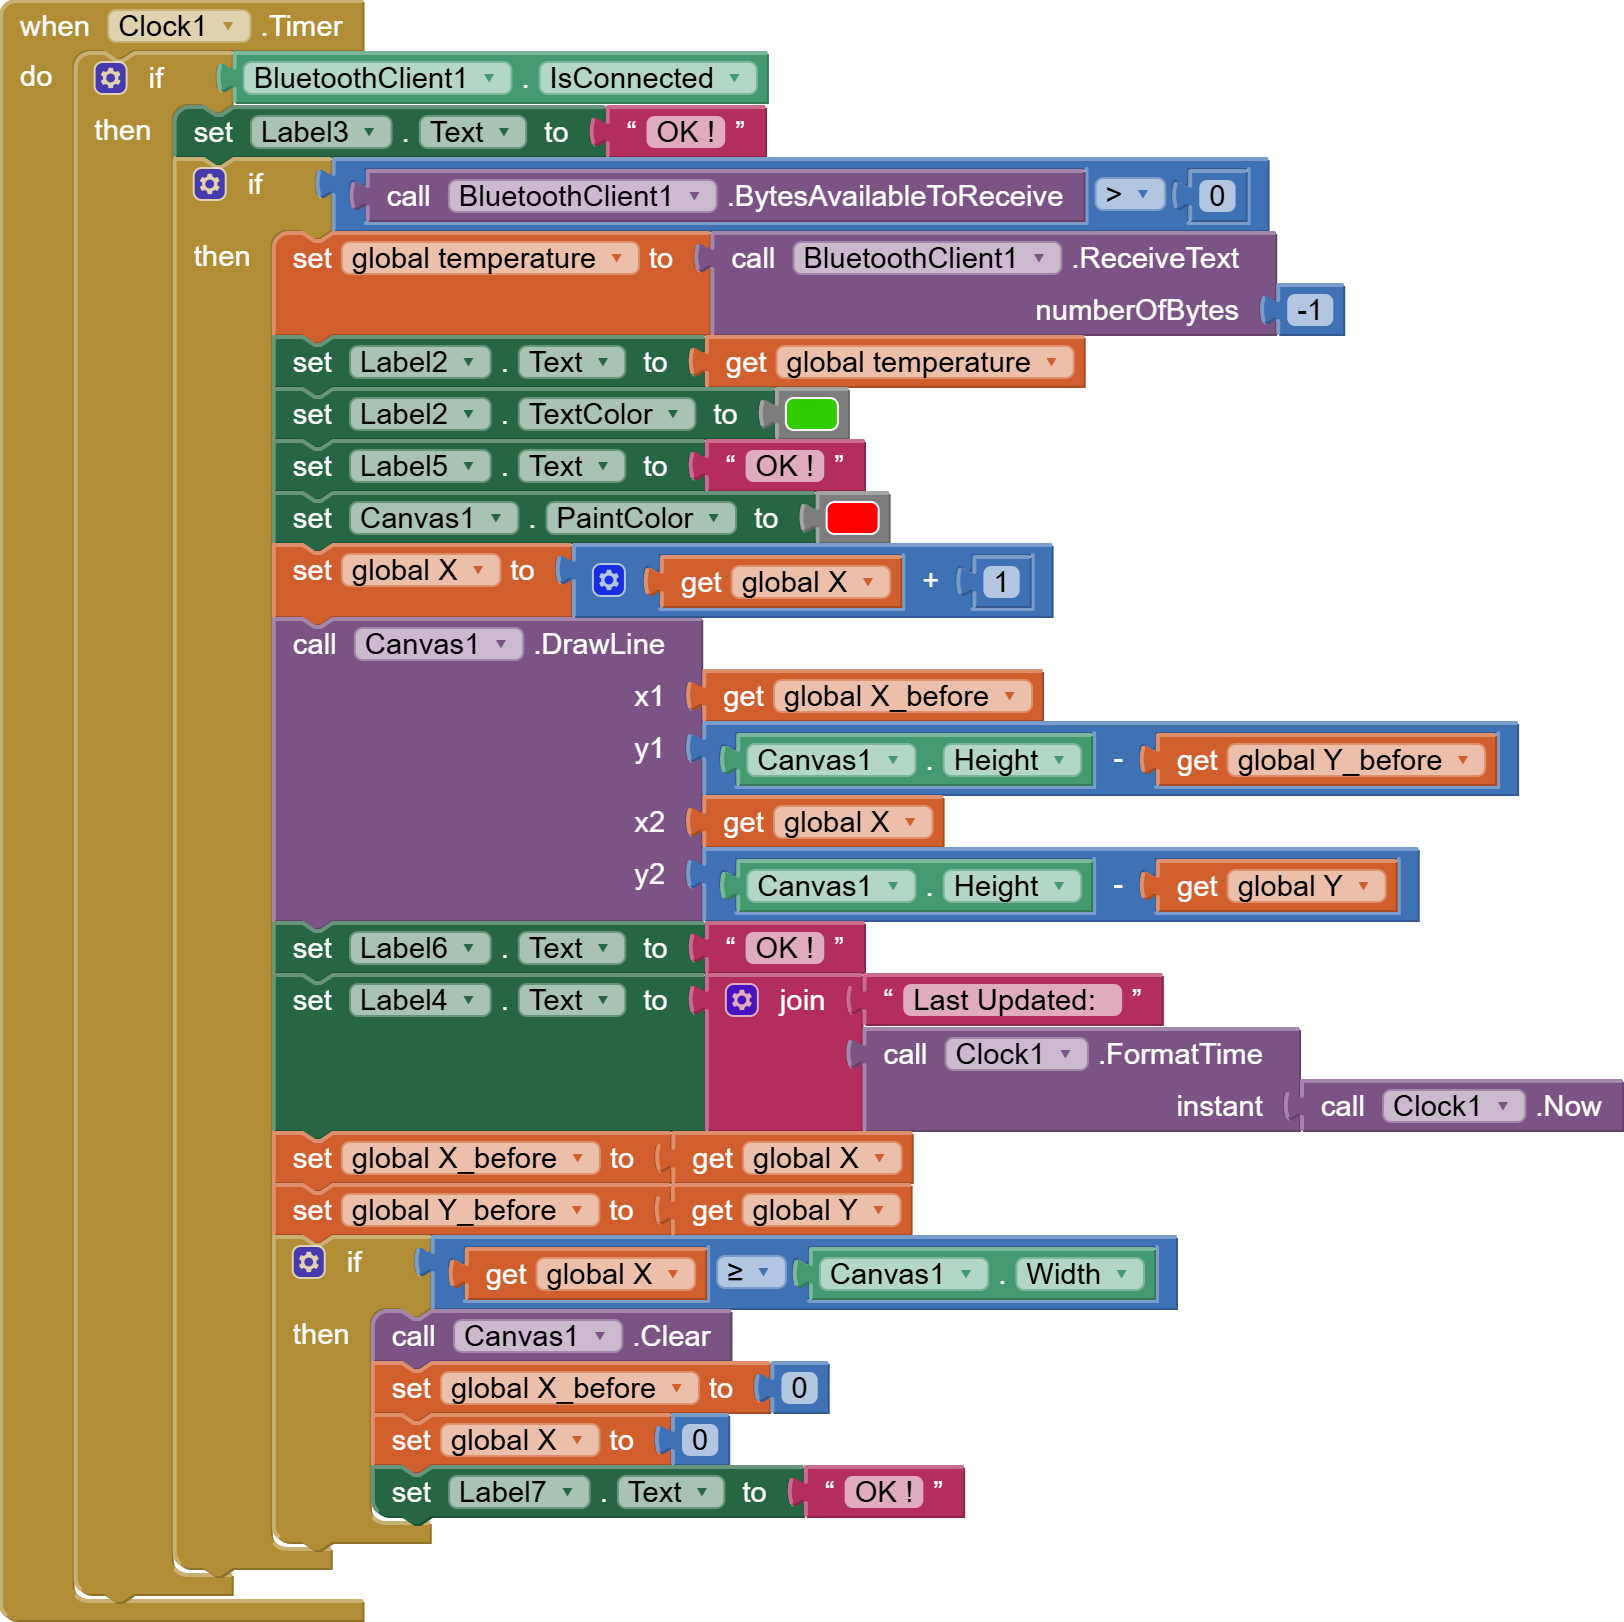
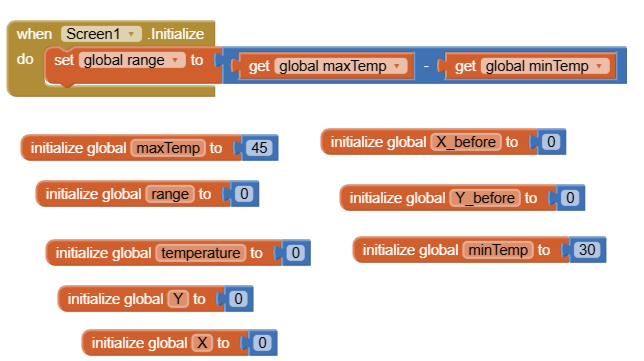
Looks like you have three opportunities for your canvas to not draw a line:
- xbefore = x , ybefore = y
- Canvas paint colour the same as canvas background colour ? You set paint colour to green after you call drawline.
- Clearing the canvas if x>CanvasWidth, and setting x and xbefore to 0

Why exactly 10 bytes?
Why do you split incoming message into a global variable, and then ignore it?
What is your split character? Are you trying to split at \n (Line Feed)?
Show us your sketch code.
Yes am trying to split at \n. I've changes to from 10 to -1
Tempgraphtrial.aia (13.9 KB)
TEMPGRAPHTRIAL.ino (990 Bytes)
This is how you are sending your temperature:
void loop() {
  // Read the analog value from LM35
  int analogValue = analogRead(lm35Pin);

  // Convert to voltage (assuming 5V and 10-bit ADC)
  float voltage = analogValue * (5.0 / 1023.0);

  // Convert voltage to temperature in Celsius
  float temperatureC = voltage * 100;

  // Send temperature via Serial (Bluetooth)
  Serial.println((int)temperatureC);

  // Display temperature on LCD
  lcd.clear();
  lcd.setCursor(0, 0);
  lcd.print("Temp: ");
  lcd.print(temperatureC, 1); // Show 1 decimal place
  lcd.print(" C");

  delay(1000);  // Update every 1 second
}
You are sending one number per line, with nothing extra on the line.
This is how you are trying to receive and process your messages:
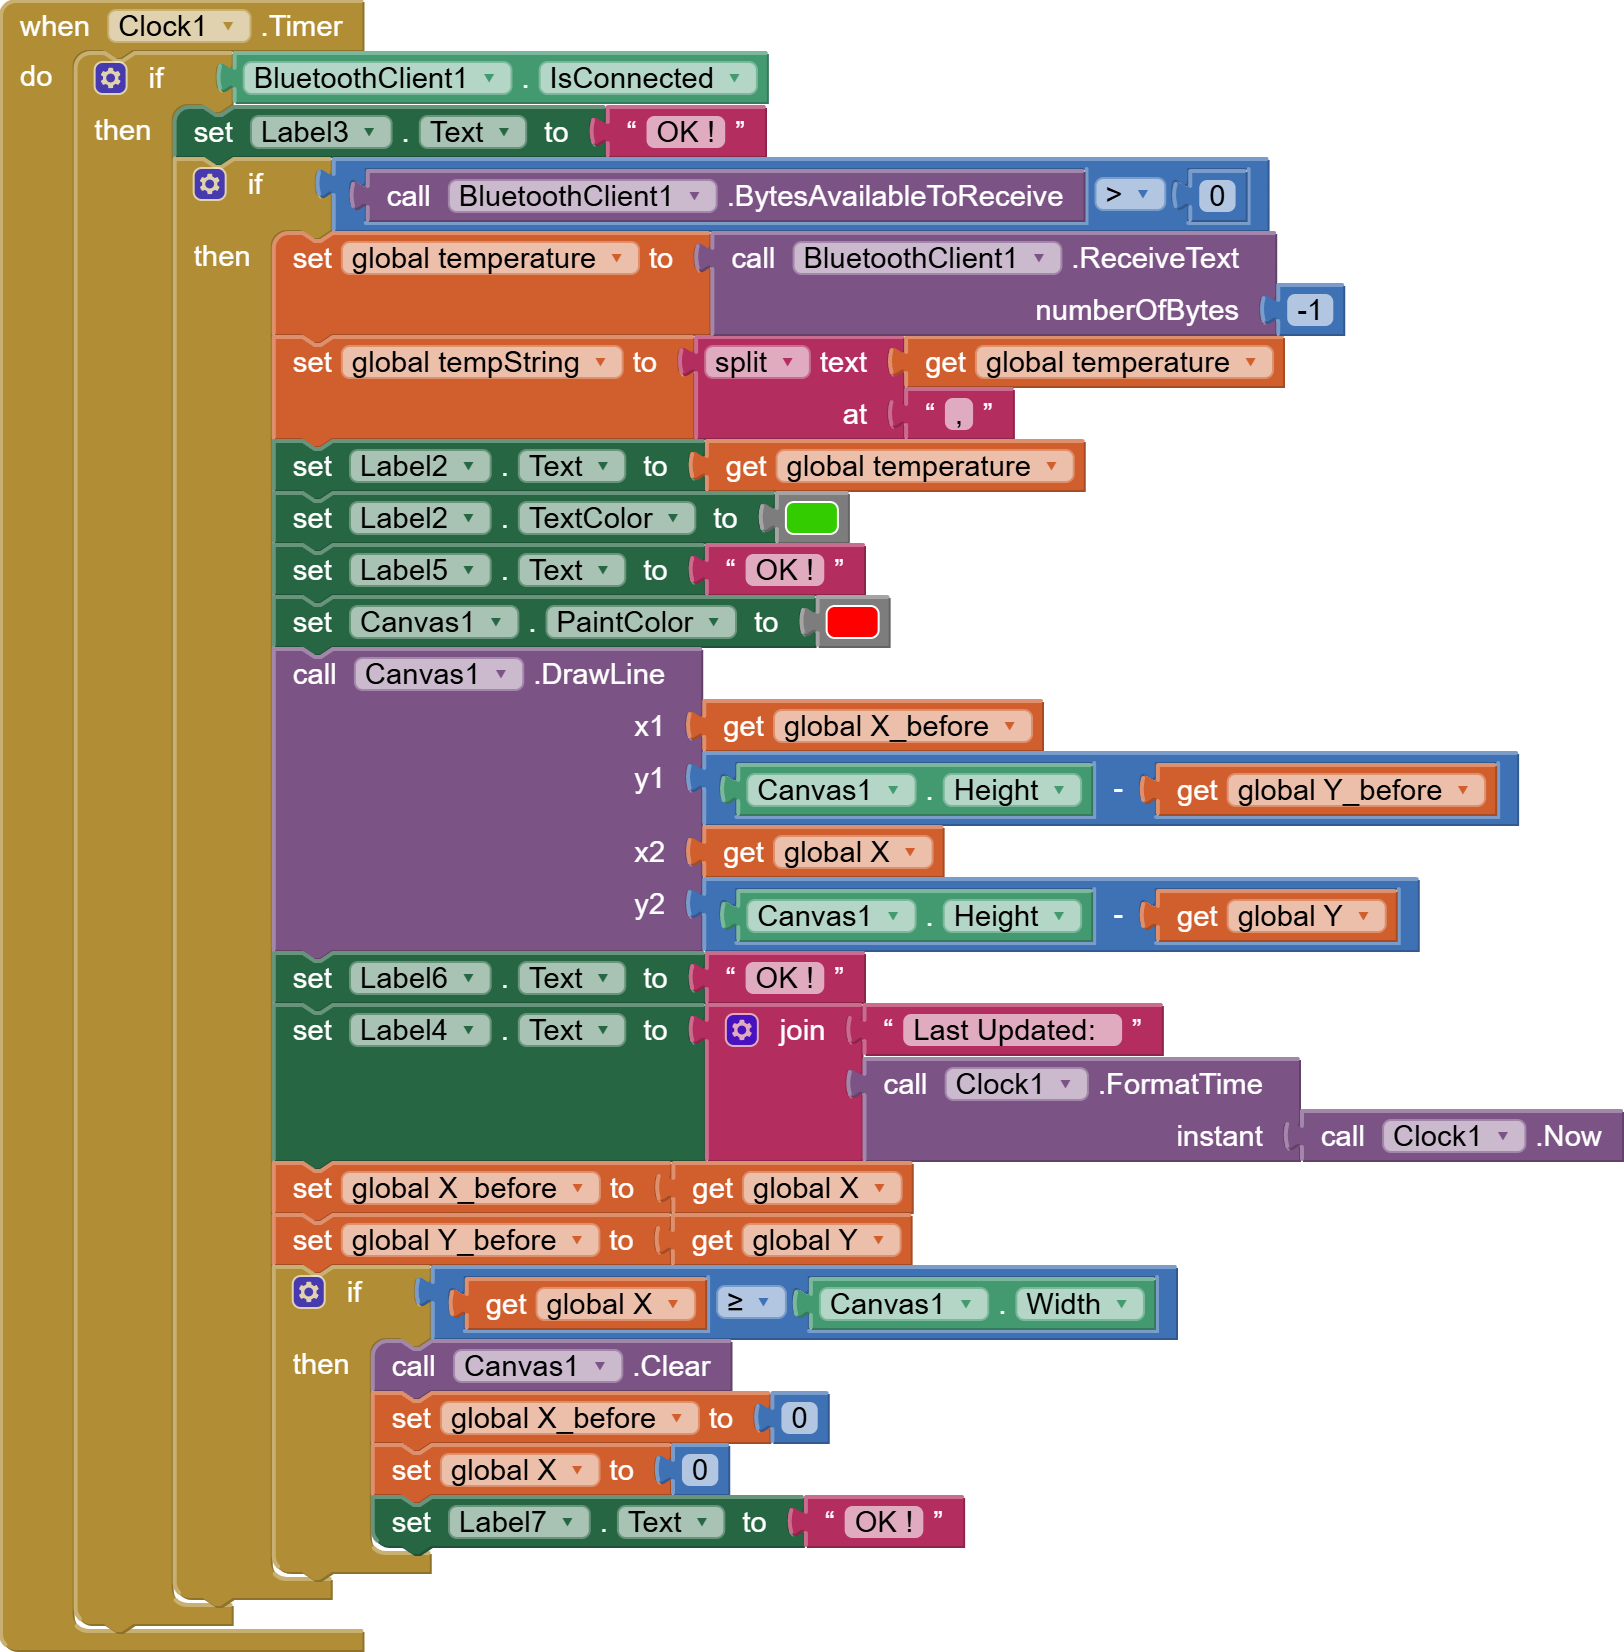
You are looking for non-existent commas.
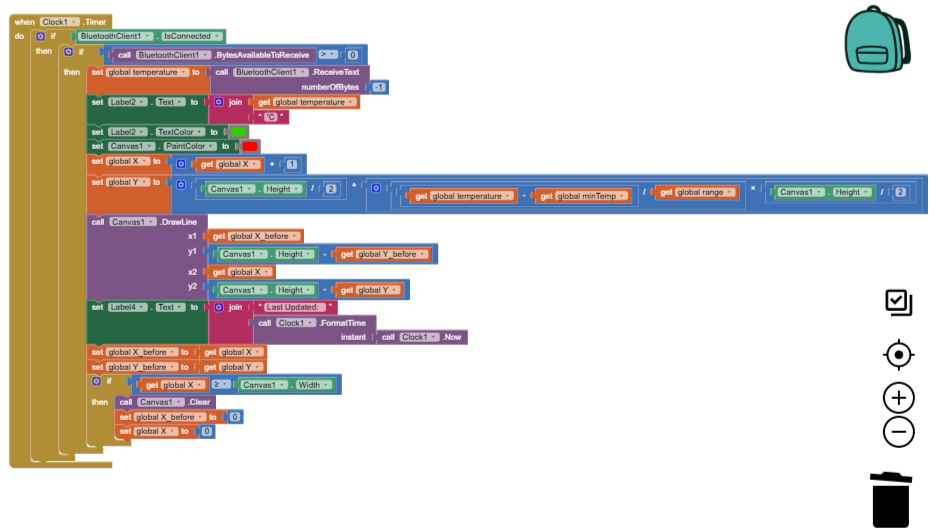
You also forgot to increment x for your graph, so your graph is just a vertical line all the way at the left.
This draggable block should address both problems:
P.S. I did not address the possible need to address vertical scaling, in case there is a big mismatch between the range of Y pixel ranges and incoming temperature values.
Also, there is a hook in the AI2 GraphData component to read such a Bluetooth data stream and plot it directly, with automatic scaling.
1 Like
Alright, am really appreciative...let me do the needful
Oops.
I never loaded temperature into Y.
Can I leave that to you?
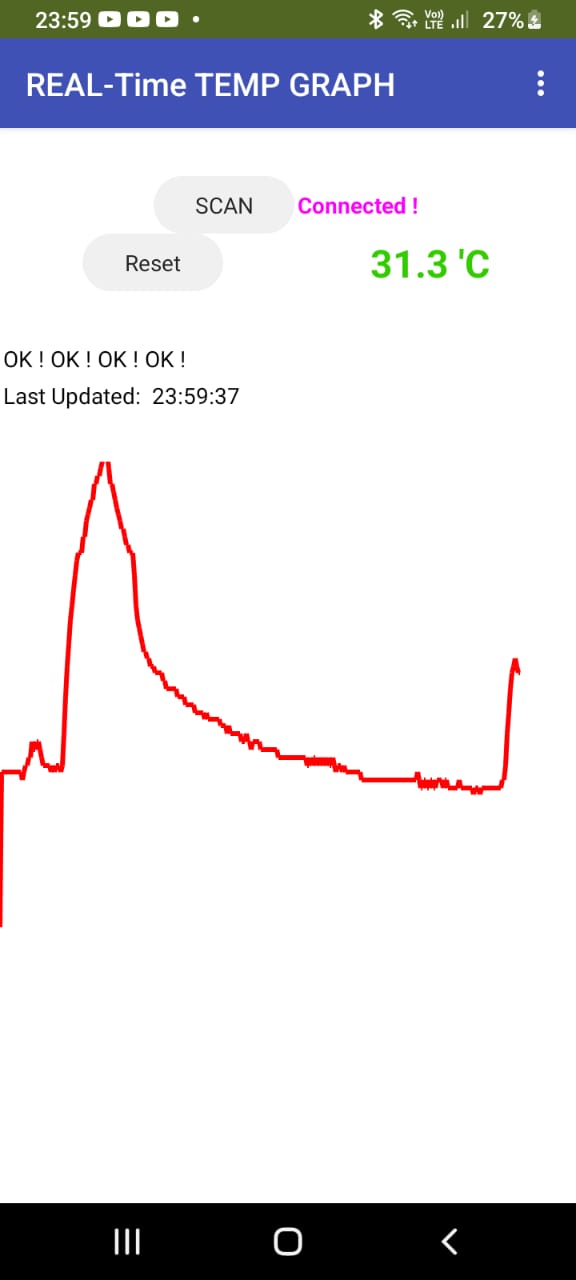
God is Good! Its done. The graph is now plotted along Y and X axis. Thank you so much for your help.
1 Like
This topic was automatically closed 7 days after the last reply. New replies are no longer allowed.