Salve,
ho creato un Barometro ed un Altimetro utilizzando l’estensione di Taifun; ma purtroppo il mio cellulare non è provvisto del sensore barometrico. Quindi vi chiedo invece come è possibile creare un altimetro, che si collega tramite il sistema GPS; per rilevare quindi l’altezza?
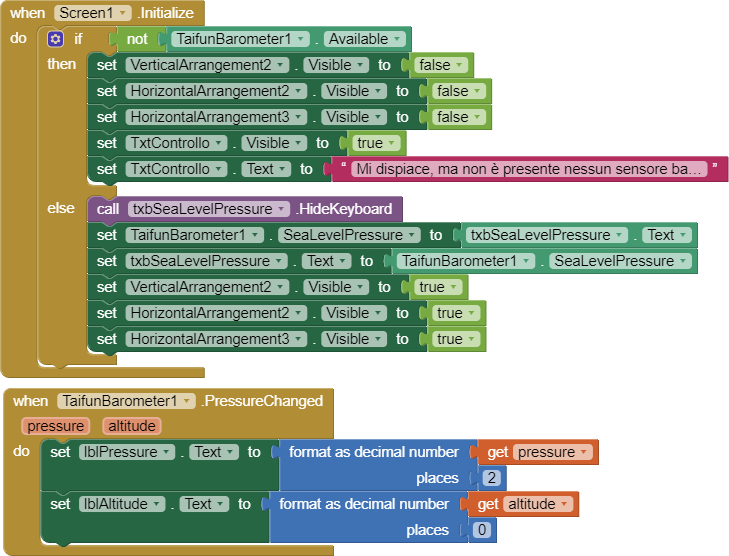
Vi allego i miei blocchi
Grazie
Nicola
Google Translate: @TimAI2
Hello,
I created a Barometer and an Altimeter using the Taifun extension; but unfortunately my mobile phone is not equipped with a barometric sensor. So I ask you instead how you can create an altimeter, which connects via the GPS system; to detect the height?
I am attaching my blocks
Thank you
Nicola
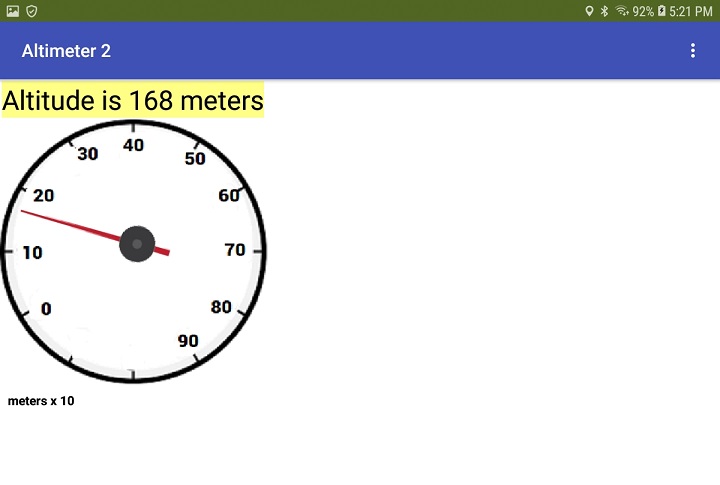
Altitude provides the Altitude of the Android device, if available.
The units is meters. The altitude is the altitude above the WGS84 reference ellipsoid, not the elevation above mean sea level. Altitude from a GPS is terribly inaccurate, even for expensive GPS receivers. Read about altitude determination here: http://gpsinformation.net/main/altitude.htm.
Altitude is very unreliable on most GPS receivers, not only those embedded in phones and tablets. Altitude reported on a phone/tablet can easily be off by +/- 30 meters or more!
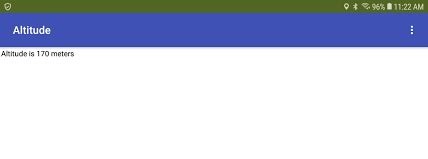
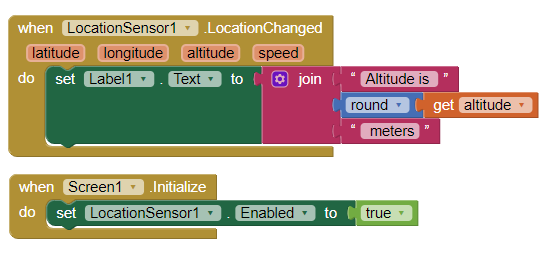
Try this basic code snippet Nicola:
The altitude will appear after about 30 to 60 seconds (after the GPS receiver obtains a satellite fix) You might read the following link to find out how this works>
Ciao Steve,
ti ringrazio per il tuo aiuto prezioso e grazie anche per il link; difatti mi ha permesso di imparare come funziona un sistema GPS.
Saluti
Nicola
Ciao Steve,
tanti anni fa, tramite Visual Basic 6.0 ho creato un orologio analogico; salvandomi 60 immagini che rappresentavano i 60 secondi e 12 immagini che rappresentavano le ore…quindi mentre in una TexBox il conteggio procedeva tramite un Clock; io utilizzavo la seguente procedura:
Select Case TexBox.Text
Case “1”
Image1.visible = True
Case “2”
Image2.visible = True
Etc. :occhiolino:
Adesso ti chiedo come posso far rispecchiare l’altezza ricevuta tramite il GPS, su di un altimetro analogico?
Saluti
Nicola
Hi Steve,
many years ago, through Visual Basic 6.0 I created an analog clock; saving me 60 images representing 60 seconds and 12 images representing hours … so while in a TexBox the counting proceeded through a Clock; I used the following procedure:
Select Case TexBox.Text
Case “1”
Image1.visible = True
Case “2”
Image2.visible = True
Etc.: wink:
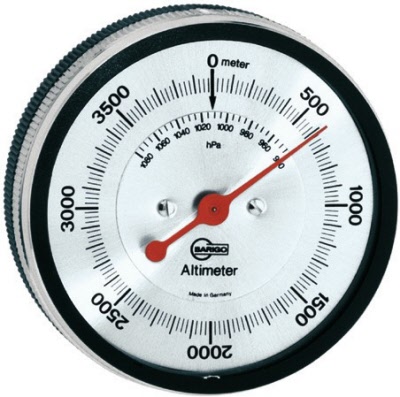
Now I’m asking you how I can mirror the height received via GPS on an analog altimeter? Altimeter-4000mt-barometer-barigo-25
Regards
Nicola (Google translate by Taifun)
The Gauge face is an image set to the background of a Canvas. An ImageSprite is the pointer
Use the Altitude in an Procedure to get the dial to point to correct values on the dial using a set ImageSprite.Heading to block. The Heading is in degrees; convert values into degrees. [Chapter 17. Creating Animated Apps ).(http://www.appinventor.org/bookChapters/chapter17.pdf) Figure. 17-12 shows how heading works.
Use either a different meter face for 0-100, 0-1000 meters or a single face and provide a note that the gauge reads in meters x 10; meters x 100 etc. as shown. This is not difficult to code using If…then…else statement. Trial and error is required to ‘calibrate’ the meter (I used a modulo Math routine like this
Fudge is variously the Altitude divided by 10 or 100 or 100 depending on the whether the Altitude is less than 1000 meters and the gauge’s scale. Experiment
The Procedure gaugeHeading might work for you . Will it? That depends on your Canvas and image sizes and how many major ticks the gauge displays. When you set the dimensions of your Canvas, avoid headaches and set Height and Width to pixels.
Use an extension. There is probably an extension that creates a gauge.
Ciao Steve,
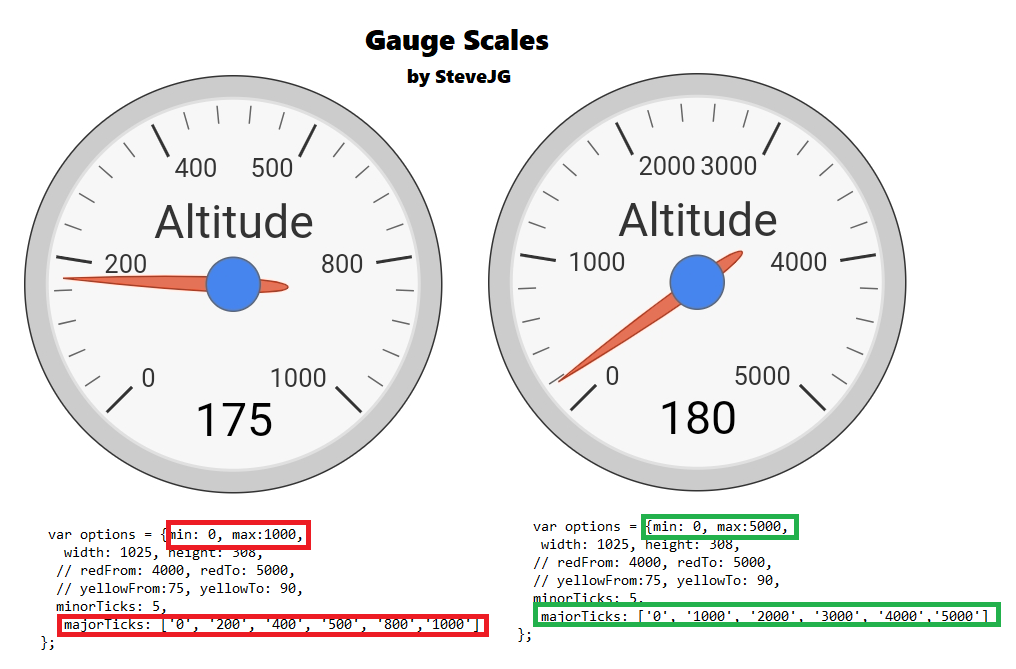
a quanto vedo, la app di esempio di Gerard potrebbe fare al mio caso; però come potrei ingrandire il quadrante e fargli segnare ad esempio fino a 5000 metri?
Questo è il contenuto del suo file HTML:
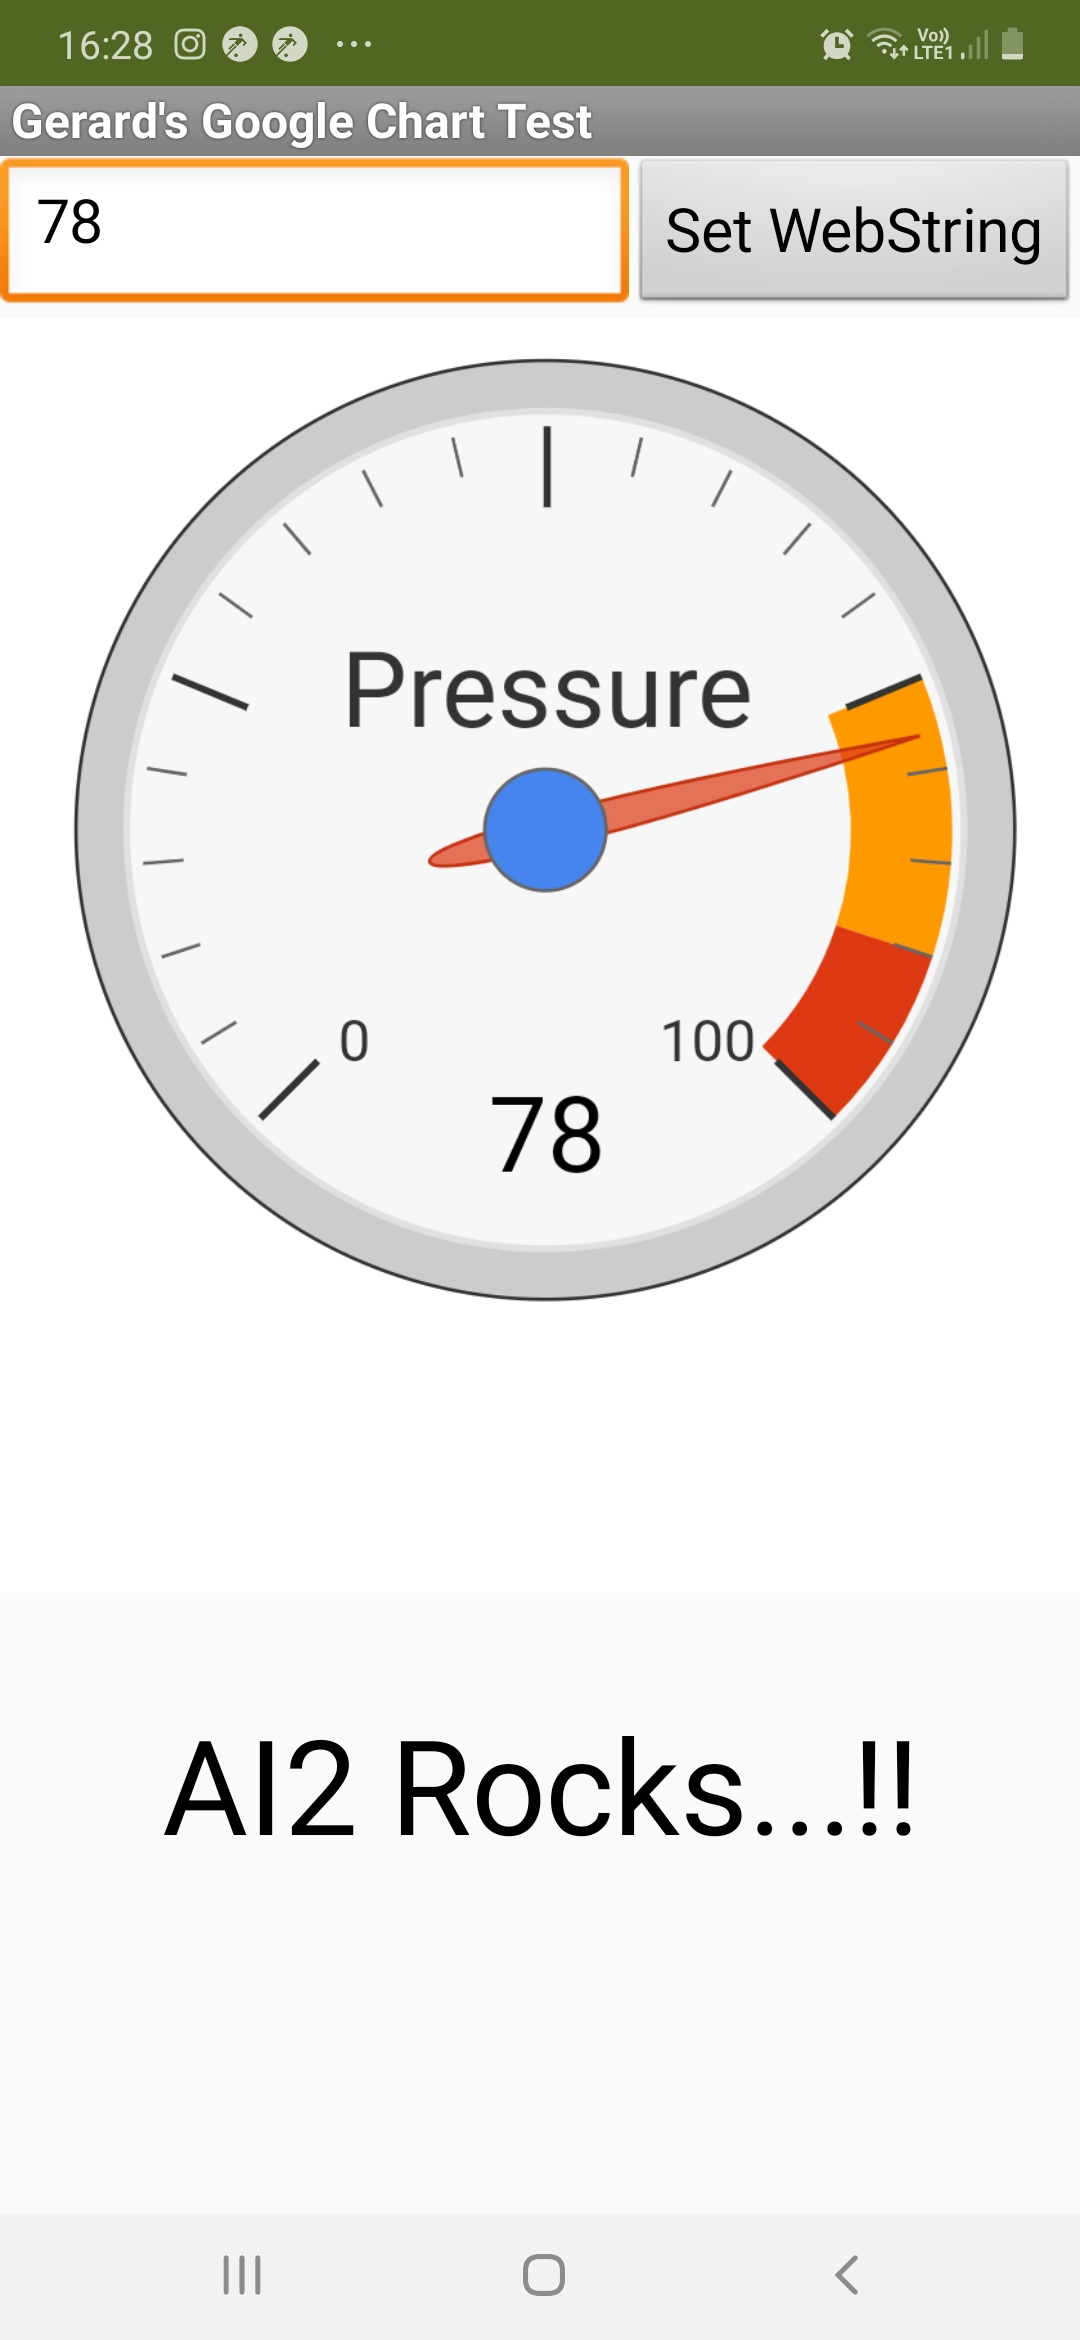
in your existing html with the example code. Does the example help you produce the Gauge face you require? Unfortunately, Google’s documentation examples for Google Charts leave a lot to be desired.
Ciao Steve,
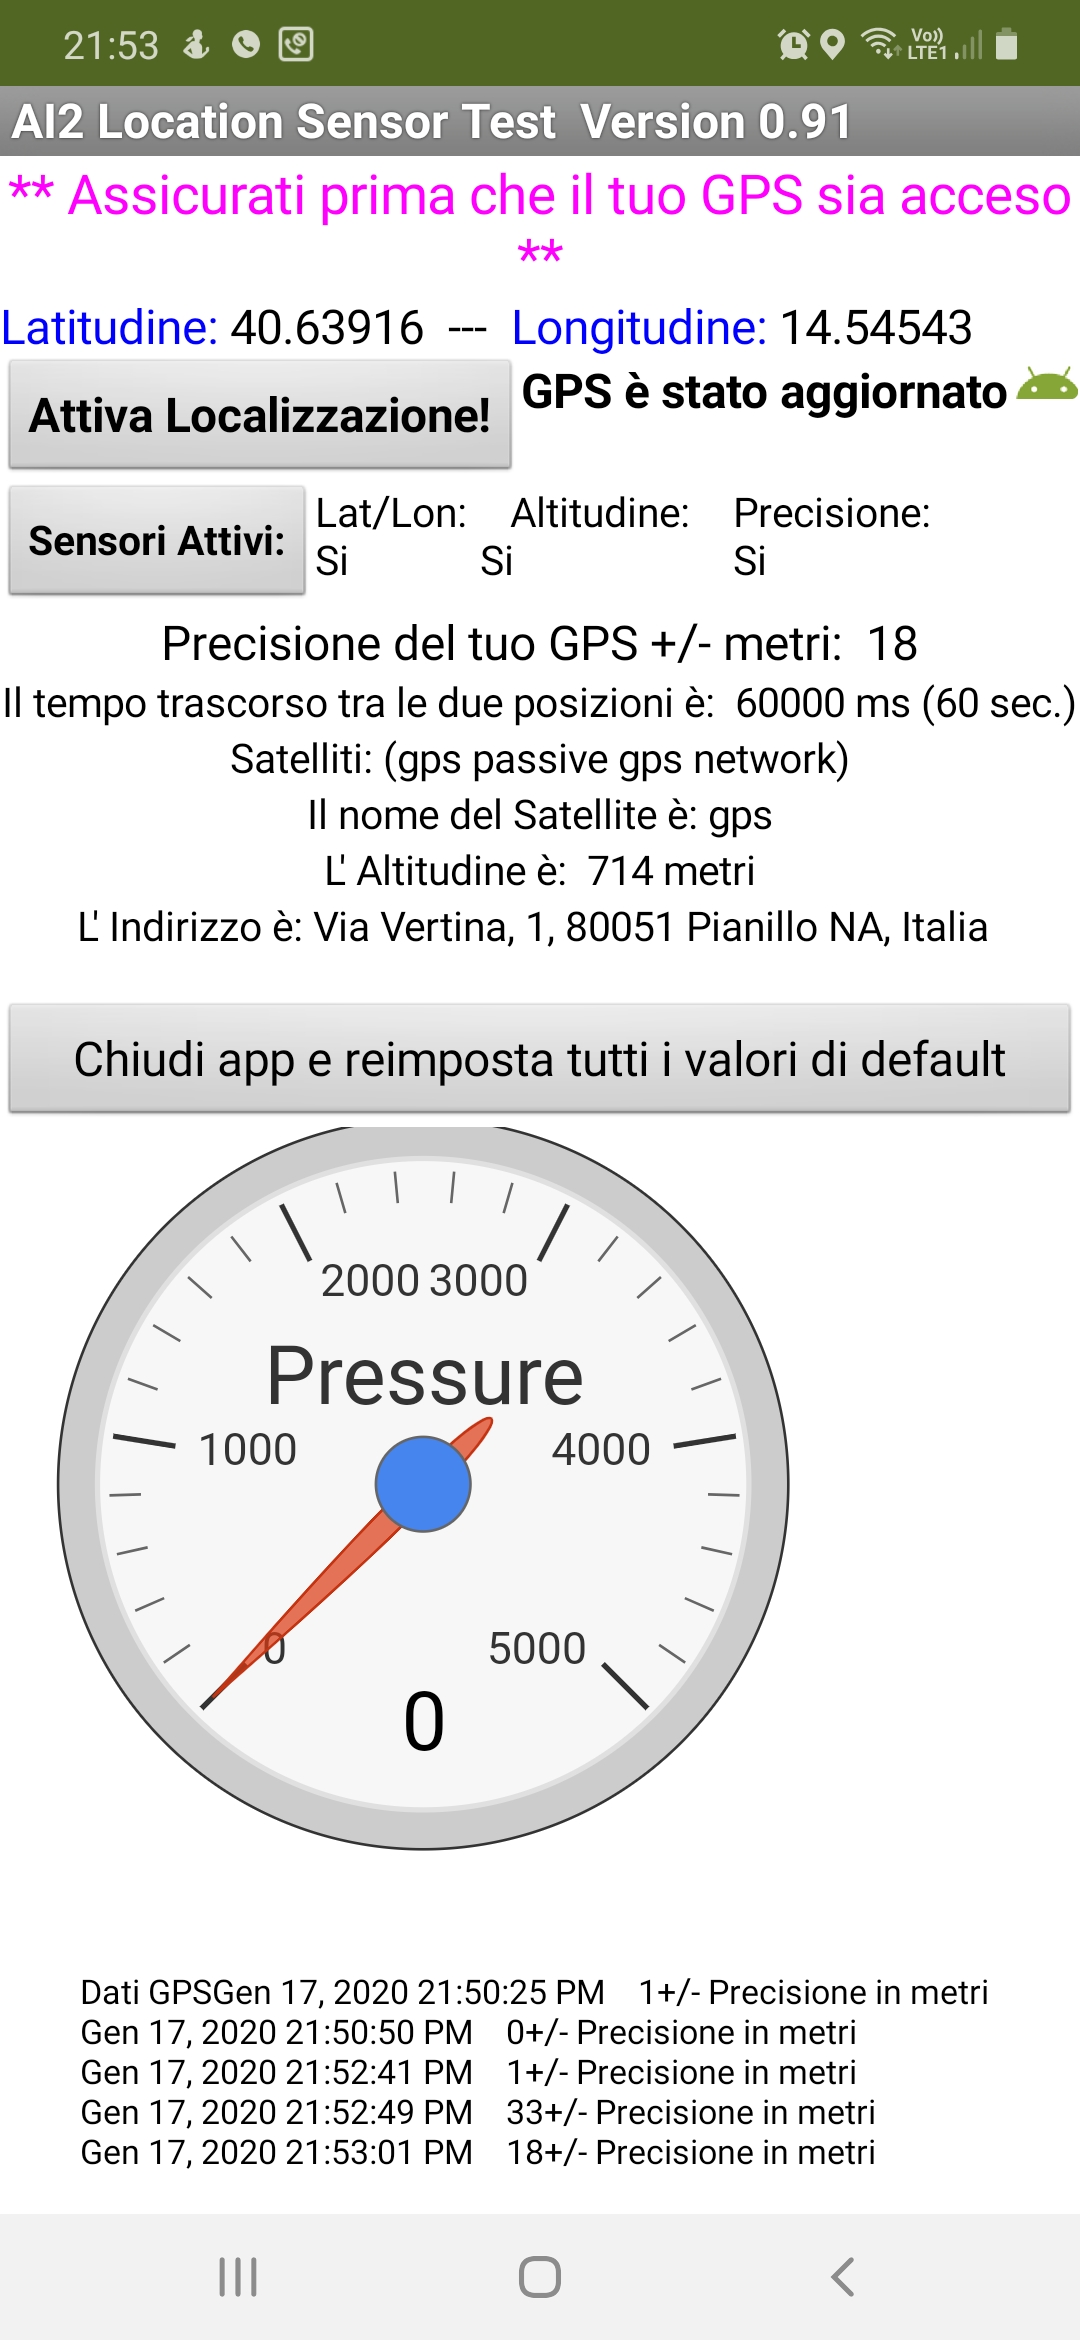
ho modificato il file HTML per manipolare la faccia del calibro; ma quando vado a collegare il WebView al LocationSensor.Altitude; non funziona.
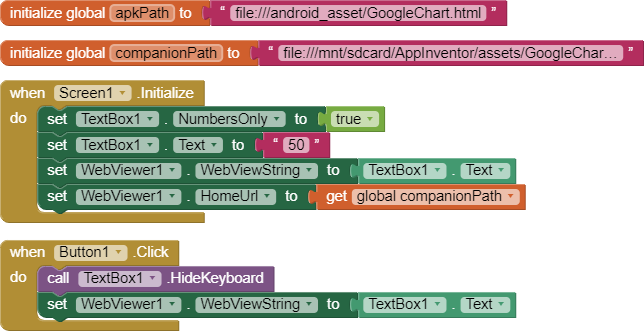
You set WebViewer1.WebViewString to ….Altitude in Screen1.Initialize. Use the set WebVIewer1.WebVIewString to the altitude value in the LocationSensor1.LocationChanged event handler if you want the altitude values to display in the meter. Not updating the Altimeter gauge appears to be the most likely issue. Is it?
Think about changing the label Pressure in the html to perhaps Altitude too?
Try again? There might be other issues you’ll need to debug. Good luck. Let us know if this fixes the app.
Ciao Steve,
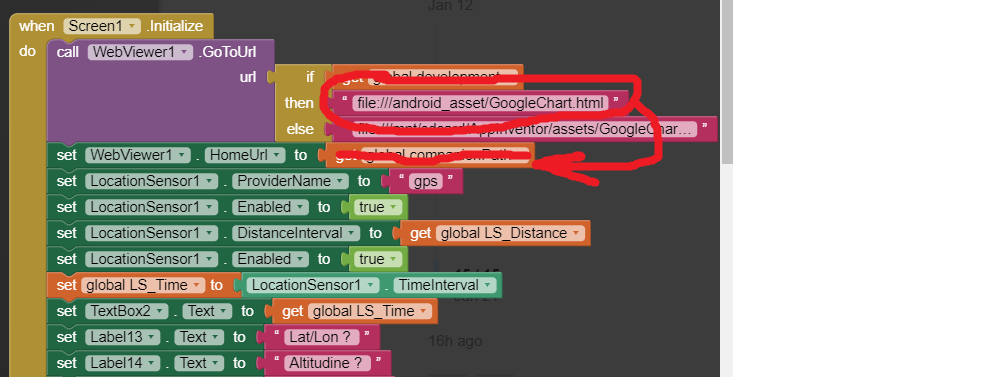
in fase di progettazione tutto bene, ma in fase di compilazione mi da errore di accesso; anche se il development è impostato su False.
Saluti
Nicola
Perhaps this is the issue Nicola: You select a path for production AND THEN you set the WebViewer to companionPath. Does that make sense; obviously you should set the WebViewer to the path required use to build the apk. You probably do not want to set the WebViewer to GotToUrl; what you want is the WebViewer to use a HomeURL that points to the production path.