Regarding your urge to try to show data in a table, that works best on paper, not on small phone screens.
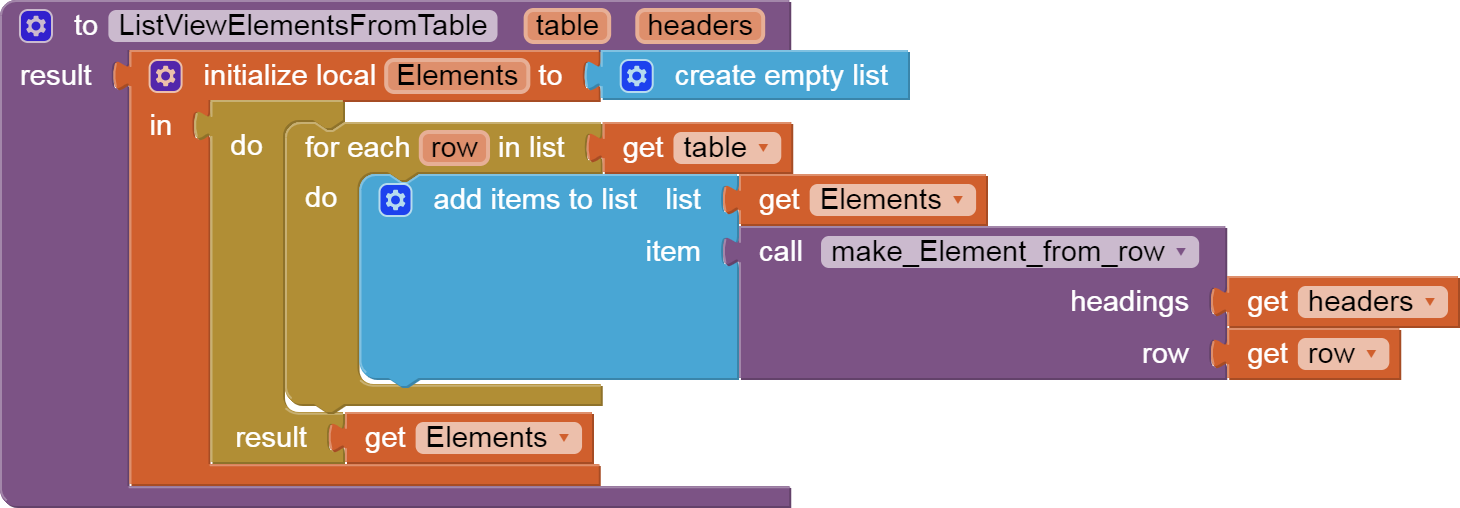
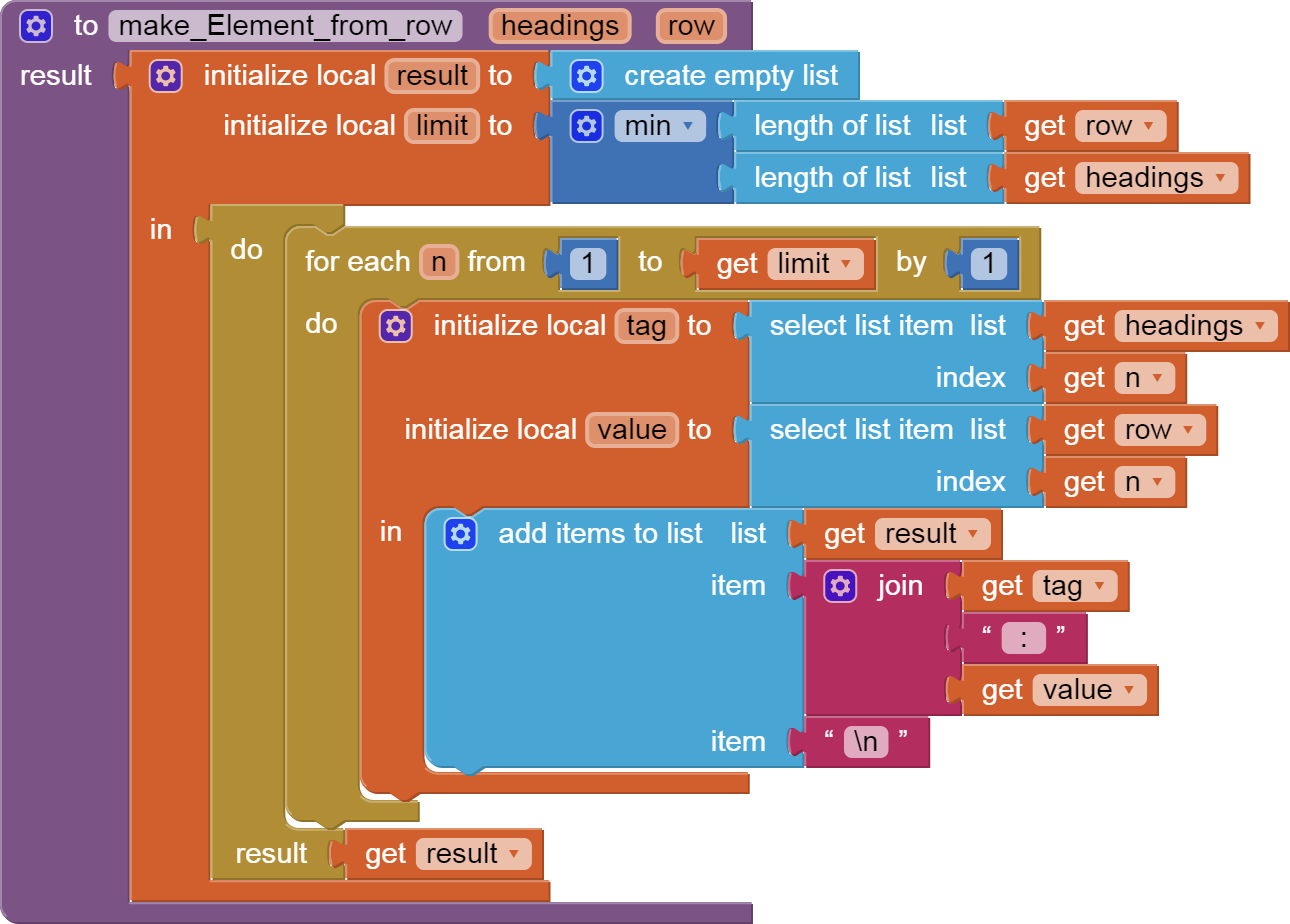
You can squeeze your table into a List Picker or ListView by combining headers and cell contents of a row into single list Elements in a tag:value format, like
header1:value of row 1 column 1
header2:value of row 1 column 2
...
header6:value of row 1 column 6
============ (new list element)
header1:value of row 2 column 1
header2:value of row 2 column 2
...
header6:value of row 2 column 6
============ (new list element)
...
...now I have to go (I'm in the European time zone) but tomorrow I will try to understand how to apply it.
Today I kept looking for the solution to fix the list of the "Save" button, but I didn't solve it...
bye
...and what about the columns? ...the user must be able to quickly compare all the perceptions detected for example in the index finger over the course of the day or week.
The table should look on the phone exactly like the one in the file "data examples.pdf".
..is it possible?
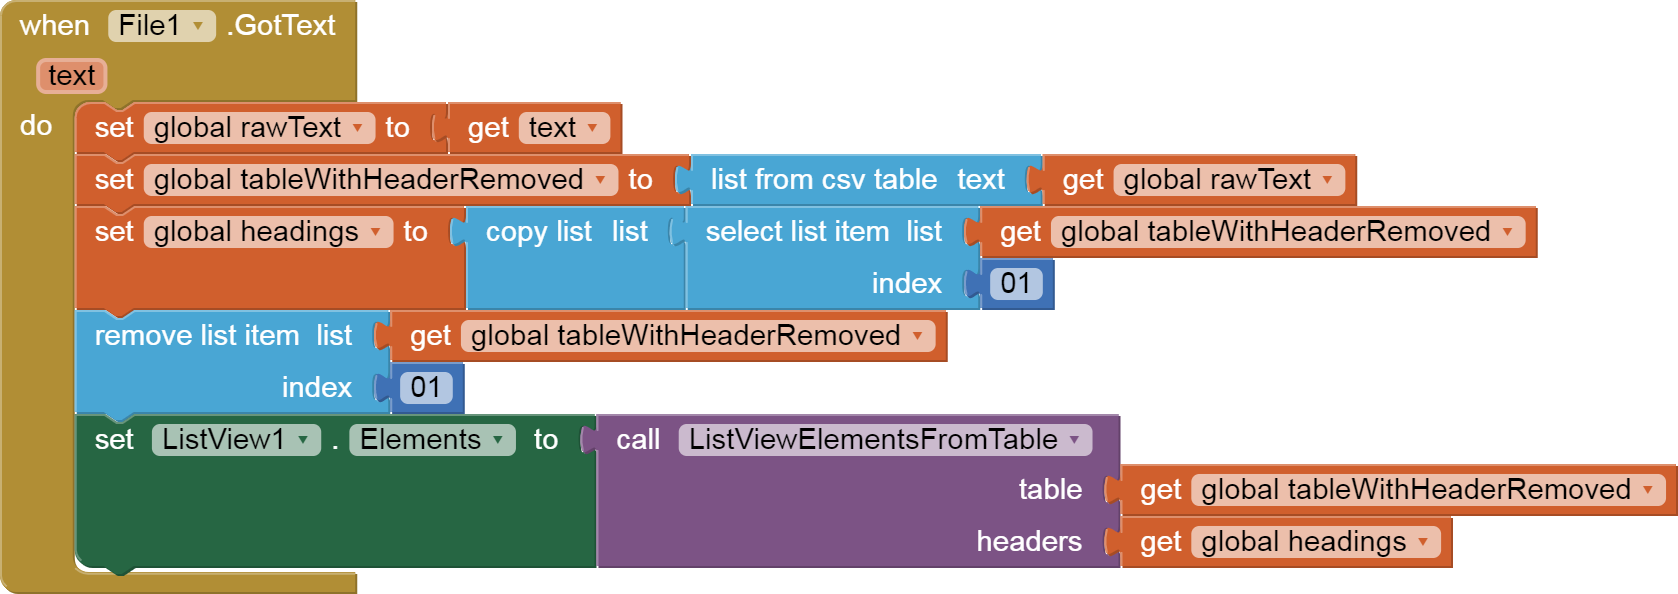
Once you have the data for that range extracted from TinyDB into a runtime table (list of lists), you can do SQL-like SELECTion of particular columns and filter by date and time range, using procedures from this sample package: select_where_equijoin.aia (12.8 KB)
For this question, you are in extension or WebView territory:
Yes, I need to see all the data together divided by columns in a table.
I quickly looked at the links for the creation of charts but I don't see anything there that looks like my table, ...but you know them well, is there something useful to me?
I would avoid using the web viewer, ..the table display should be independent of the internet connection.
...here I send you one of my files where I am doing the tests ...in this one I have paste the TableView extension. Nadi_TableView 01.aia (828.7 KB)
There are Javascript stunts using the WebViewer that use purely internal data.
No internet access is needed for those. @Taifun has a good table display sample at his puravidaapps web site.
Thanks ...I already have the Dynamic Table set up in one of my previous files. It was created on screen2 but now I am keeping everything on screen1 and when i tried to move blocks to screen1 the app had completely slowed down. Also I was not able to adapt the blocks to the screen1 well. Nadi_copia6_withDynTable_MIT.aia (373.1 KB)
So now I have suspended that solution and am intrigued by Abraham's proposal. I'd like to see that table that uses web viewer.

 ...in this one I have paste the TableView extension.
 ... can you recommend anything else?
 ...I already have the Dynamic Table set up in one of my previous files. It was created on screen2 but now I am keeping everything on screen1 and when i tried to move blocks to screen1 the app had completely slowed down. Also I was not able to adapt the blocks to the screen1 well.
 Did you follow the link ?