Hi,
I have no idea if its a problem with a new app-i version but i had stopped developing with app-i for approx. half a year and now, coming back, its incredibly slow.
In between i have upgraded my hardware from intel 6700 with 32GB to ryzen 3800 with 48GB and the android device from a 2014 samsung Tab 12.1 with 3gb to a actual redmi note pro with 6 or 8GB Same resolution.
I use Firefox as browser.
And yes i know the project is possibly too big and it uses plugins and 3 Screens but it works 6 to 9 months ago - moderately slow but ok.
Now its unusable slow.
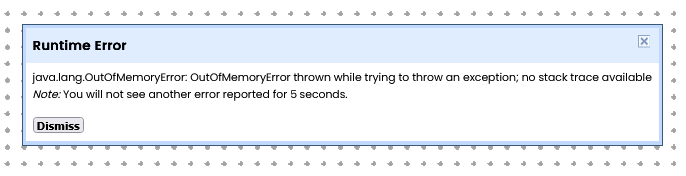
I've reduced it in the last days from 7200 to 6200 Blocks on screen1 in size. But it doesnt get better. I see sometimes java out of memory errors when allocating of small blocks of approx. 32 bytes (really bytes not kb or so) failed.
Screen2 has 2000 blocks just for initializing on first start to set up the tinydb.
screen3 has ~200 Blocks and is my database browser just for debugging.
I use Ai2helper.
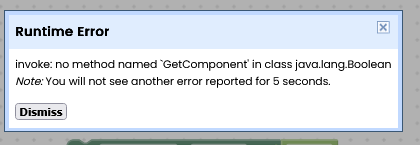
I use and need to use dynamic components.
I use tinydb.
Could it be server overload?
Any successfully reported or at least plausible ideas?
Many thanx in advance.
It sounds like there are at least two things here that have to be untangled.
First is editing performance in the browser. Generally, for large projects Firefox tends to perform better than Chrome in my experience. We have had people build larger projects than 6k blocks and your memory sounds like more than enough for something like this. When you say editing the project is slow, can you quantify this? The big change was in January when we released an update of the Google Blockly library on ai2. If there are performance regressions we will need to report them upstream.
Second seems to be performance on the phone, at least as far you are reporting "java out of memory errors when allocating of small blocks of pprox. 32 bytes (really bytes not kb or so)." OOM errors are suggesting you're already creating quite a lot of stuff in memory to get to that point. App Inventor doesn't allow for dynamic creation of components for this specific reason, and the fact that you mention using an extension to get around this limitation means you may want to look to any uses of that component to determine what's going on. A 32 byte allocation also makes a lot of sense in that case because components tend to be fairly small (versus say, images, where allocations will be on order of KB or MB).
In either case, if you post a copy of your project someone might be able to take a deeper look and see what is going on.
First many thanks for your efforts.
Editing (unconnected) is not really the problem at the moment.
It was also slower when i was on 7.2 but now on 6.2k blocks its really fast.
Nearly no issue with that. I can remember that last year with the smaller computer 7k seems to be the max blocks on one page for smooth editing which leads to the second page with the database init.
addendum: I have one small problem left while editing. The widget sometimes shows errors but i cant jump to them. In my cleanup session these days i saw up to 30 errors while no error has been produced by me. Closing and reopening the project fixes this.
But only connected editing/debugging is really the problem at the moment.
At startup i always switch to the second screen where the database is checked or generated/filled with default data. Then i switch immediately back to screen 1.
Last year this was a matter of seconds at max. Now the browser editor is blocked for a long time maybe minutes. Sometimes (maybe always) the browser is also sluggish in other tabs.Which is getting better after some time. If i move blocks on Debugging it often doesn't recognize clicks. disconnects blocks by accident or folds or unfolds blocks unwantedly. At the moment i cant do anything while connected.
The Redmi tablet Pad Pro (Not Note pro i mixed this up) i use now is quite fast. Muuuch faster than the old 2014 Samsung 12.1.
Mine has 8 GB and at the moment android 15.
I cant imagine that there could be really a low-RAM-issue but i can activate 4Gb swap space on the device if needed.
I use the dynamic components for creating hierachical Button/UI compositions out of descriptions mostly in dictionaries. So these need only small chunks of memory but ive never seen these kind of errors before in app-i.
I can upload the project for some forensics (maybe pm a link) but not to the public. it also doesn't work at the moment which is the reason why it needs debugging : -)
Today the following happend:
No other Android App (except the System apps) were running on the tablet.
Edit: Later on: