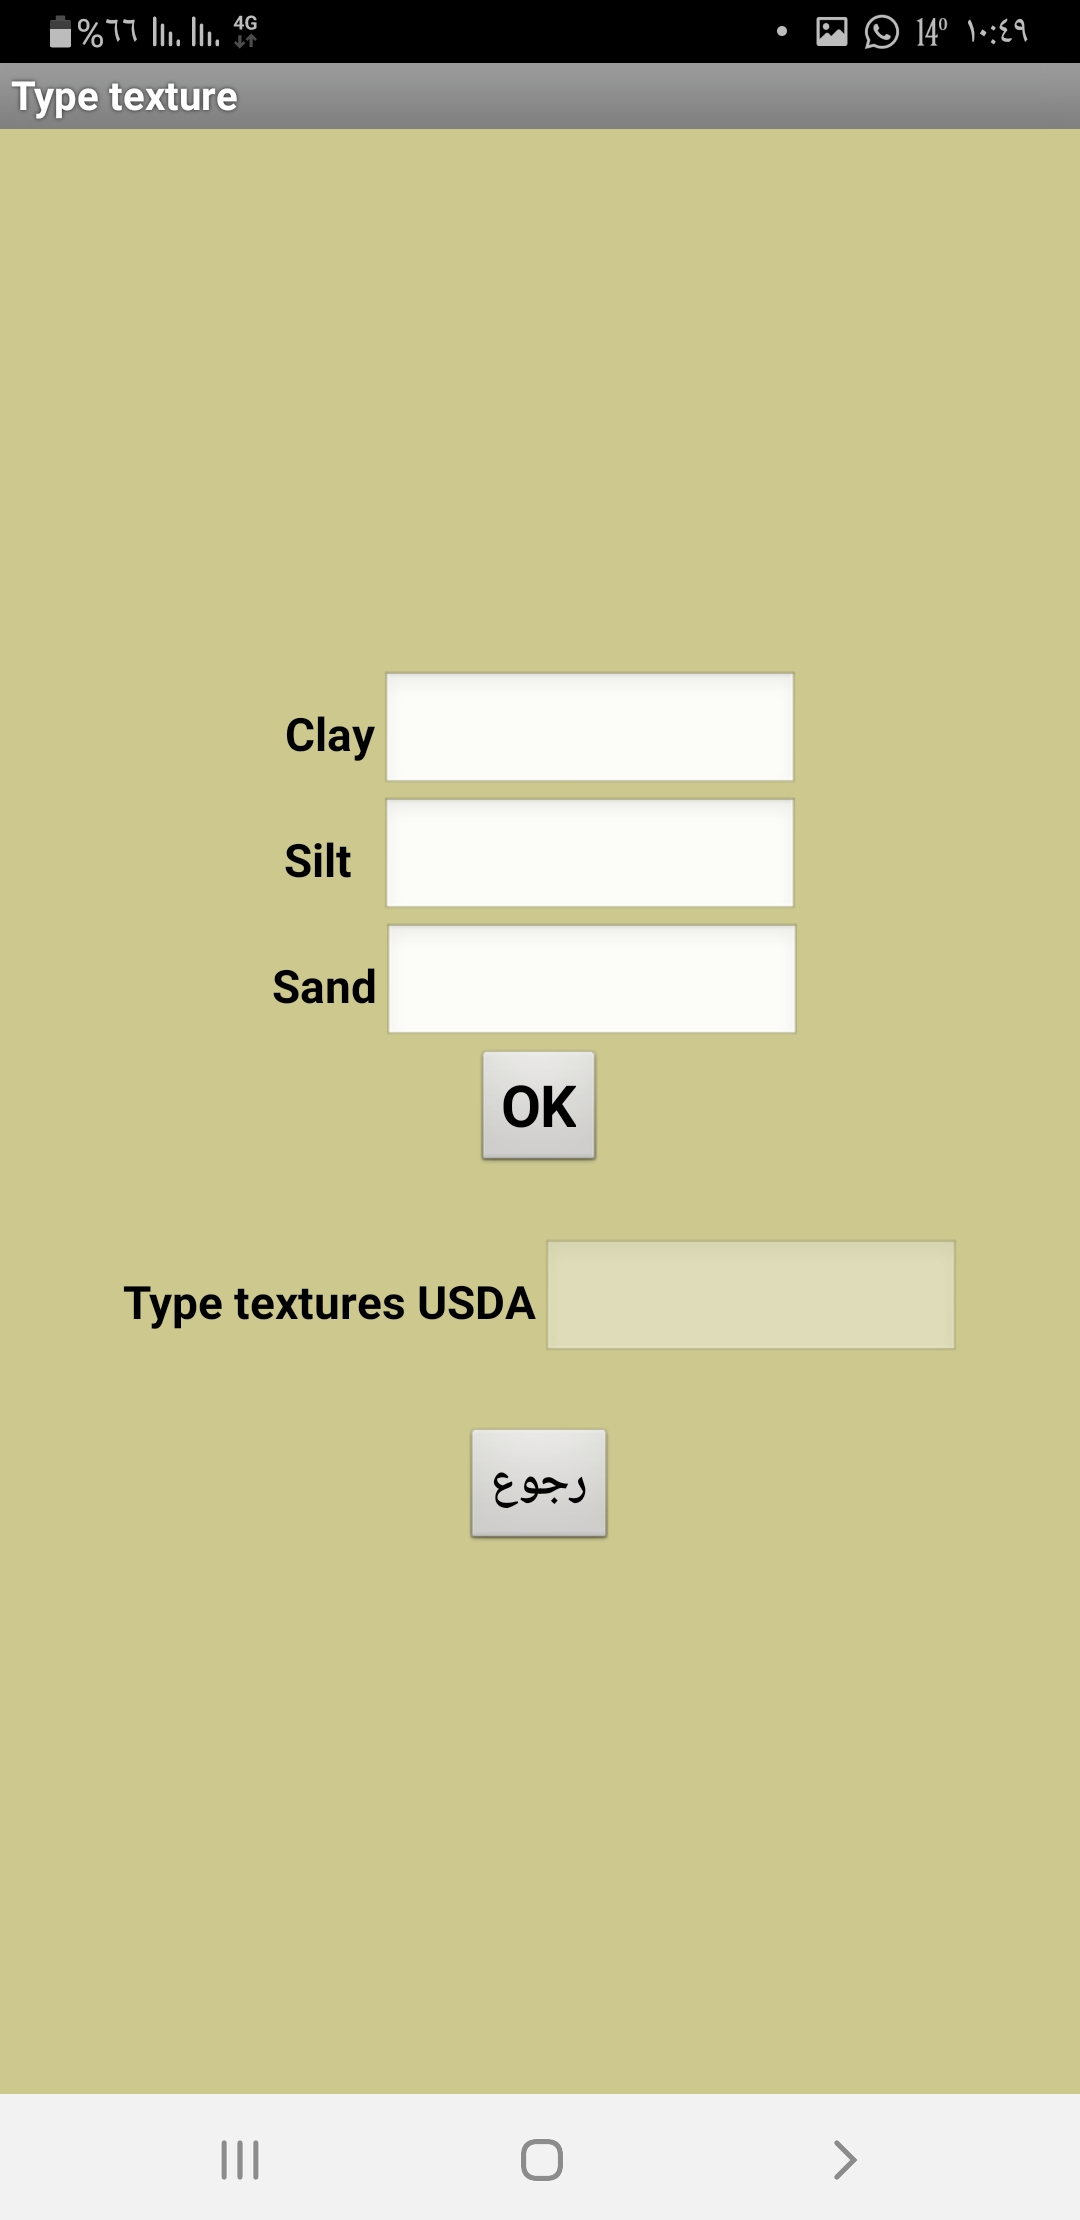
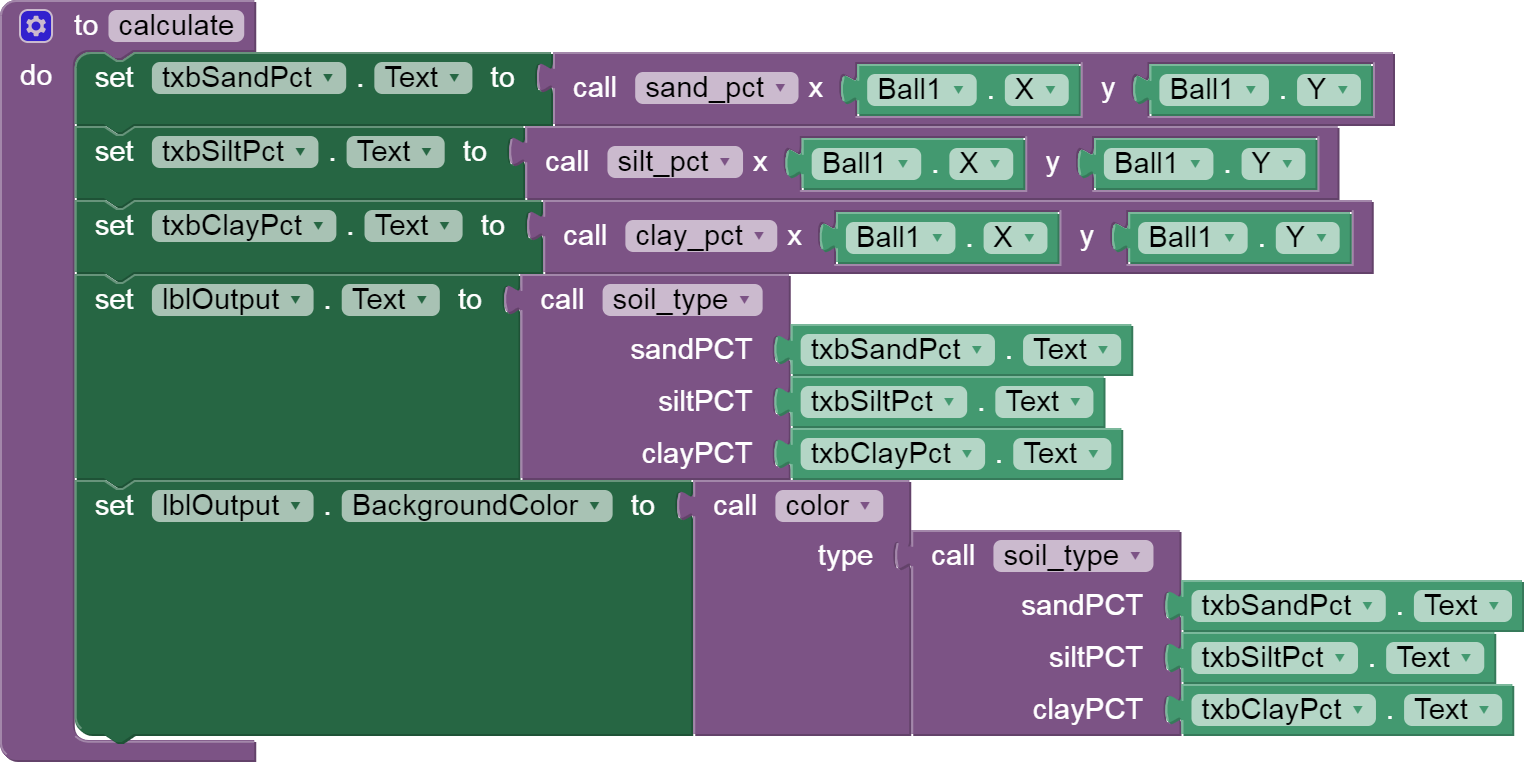
Can you help? What is the appropriate function for the command (if the number in Text 1 = 5, Text 2 = 5, and Text 3 = 90, it is called sandy)
1 Like
At last, an interesting problem.
For starters, tell us which attributes (clay %, sand %, loam %) match with your poorly named text boxes Text1-3?
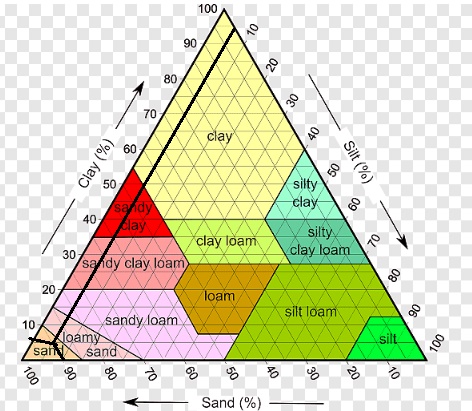
Here is a online calculator for soil classification https://www.nrcs.usda.gov/wps/portal/nrcs/detail/soils/survey/?cid=nrcs142p2_054167 . The site links to an excel spreadsheet that contains appropriate algorithms to determine a classification based on %sand, %silt and %clay. Recreate the excel Macro using Blocks and you have your solution @Mohamed_Boabass . If you notice, the algorithm uses the same ternary diagram you posted Mohamed.
1 Like
I see the problem now.
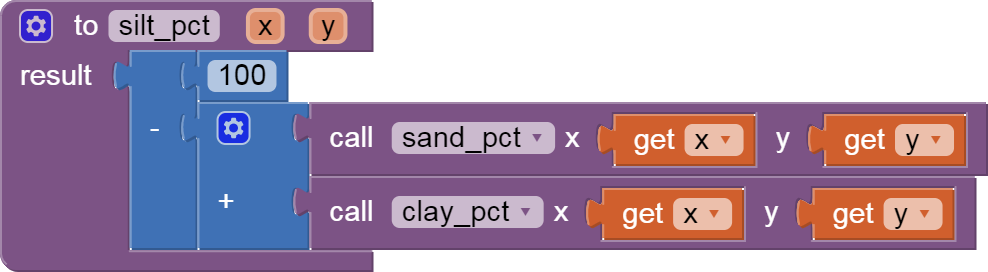
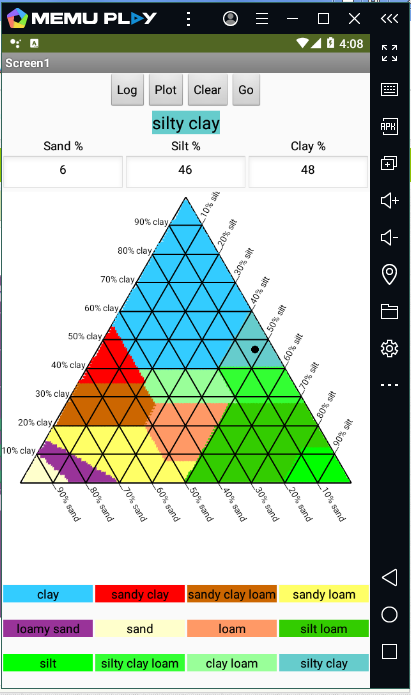
You have 3 percentages, clay, sand, silt that add up to 100.
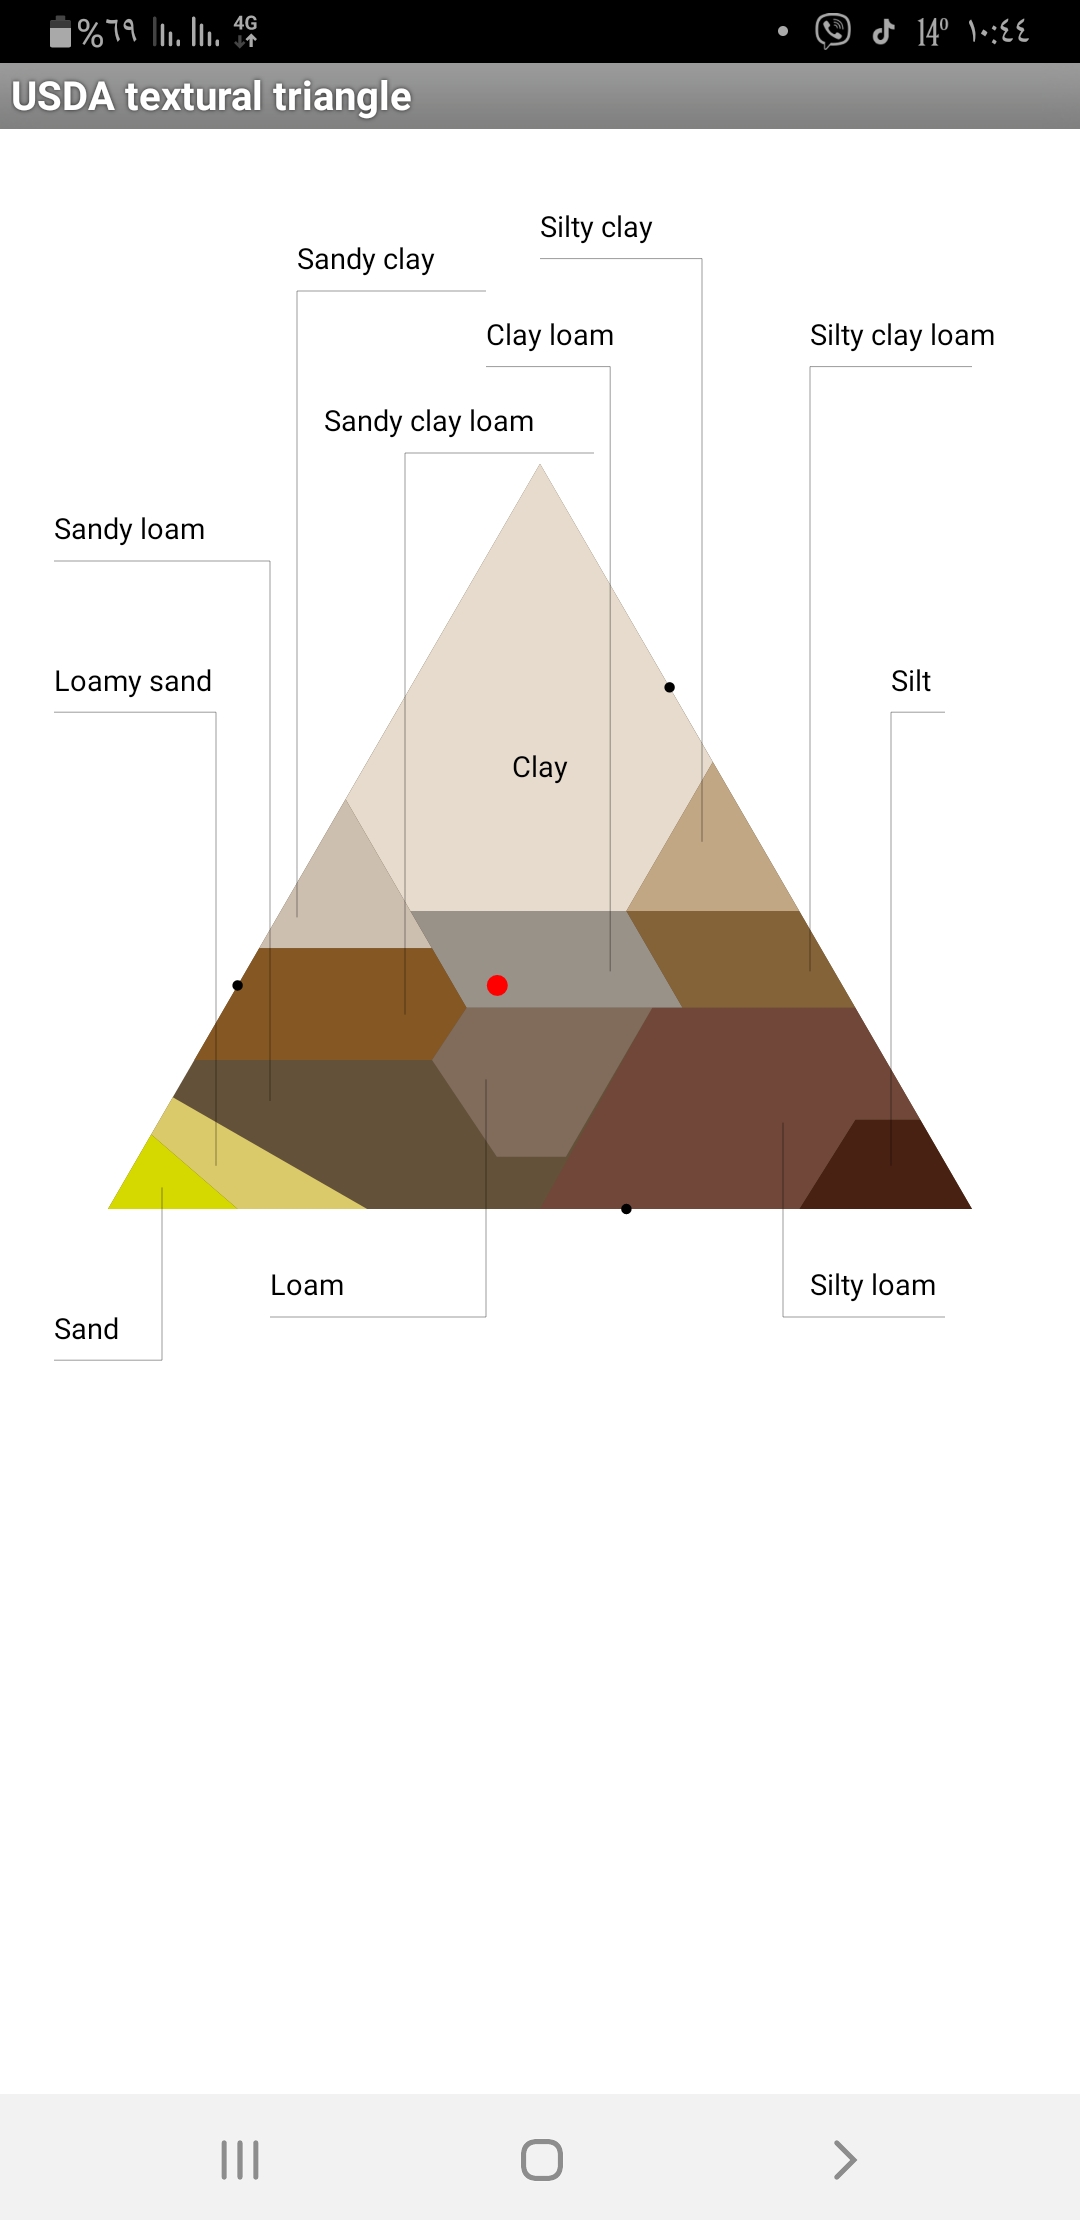
Those numbers will determine a point in the triangle.
You have to return the label for the area inside holding that point.
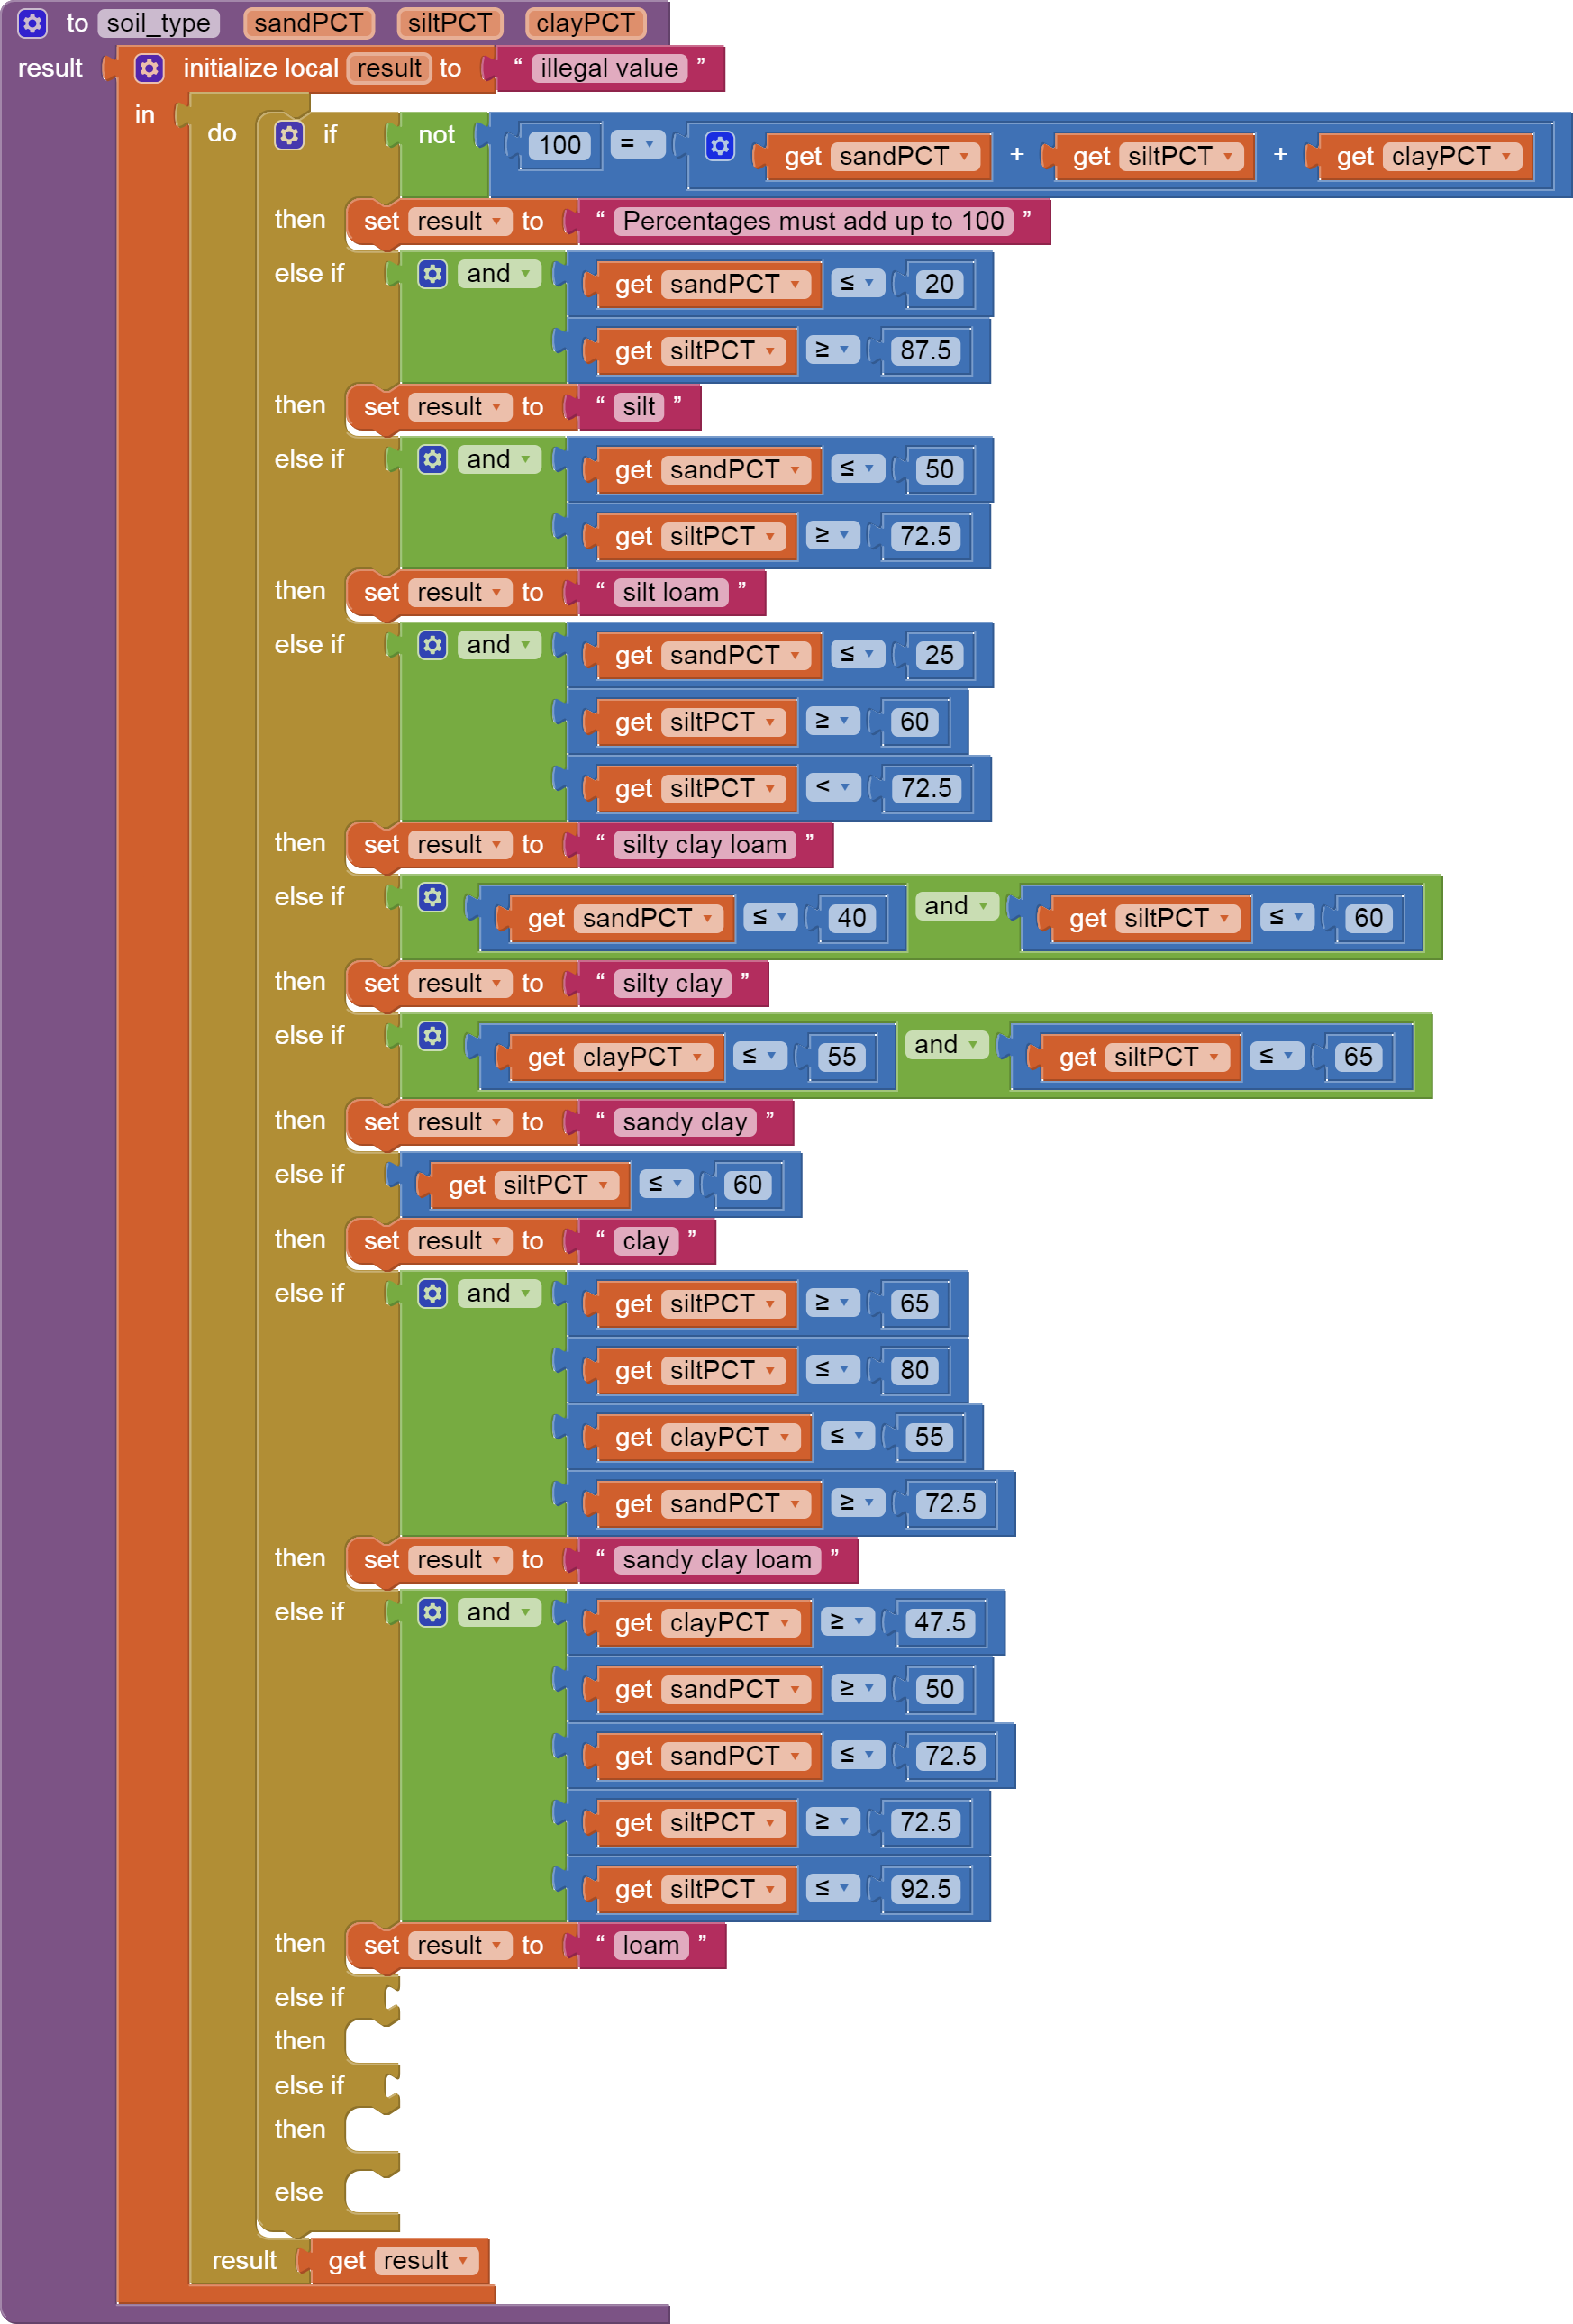
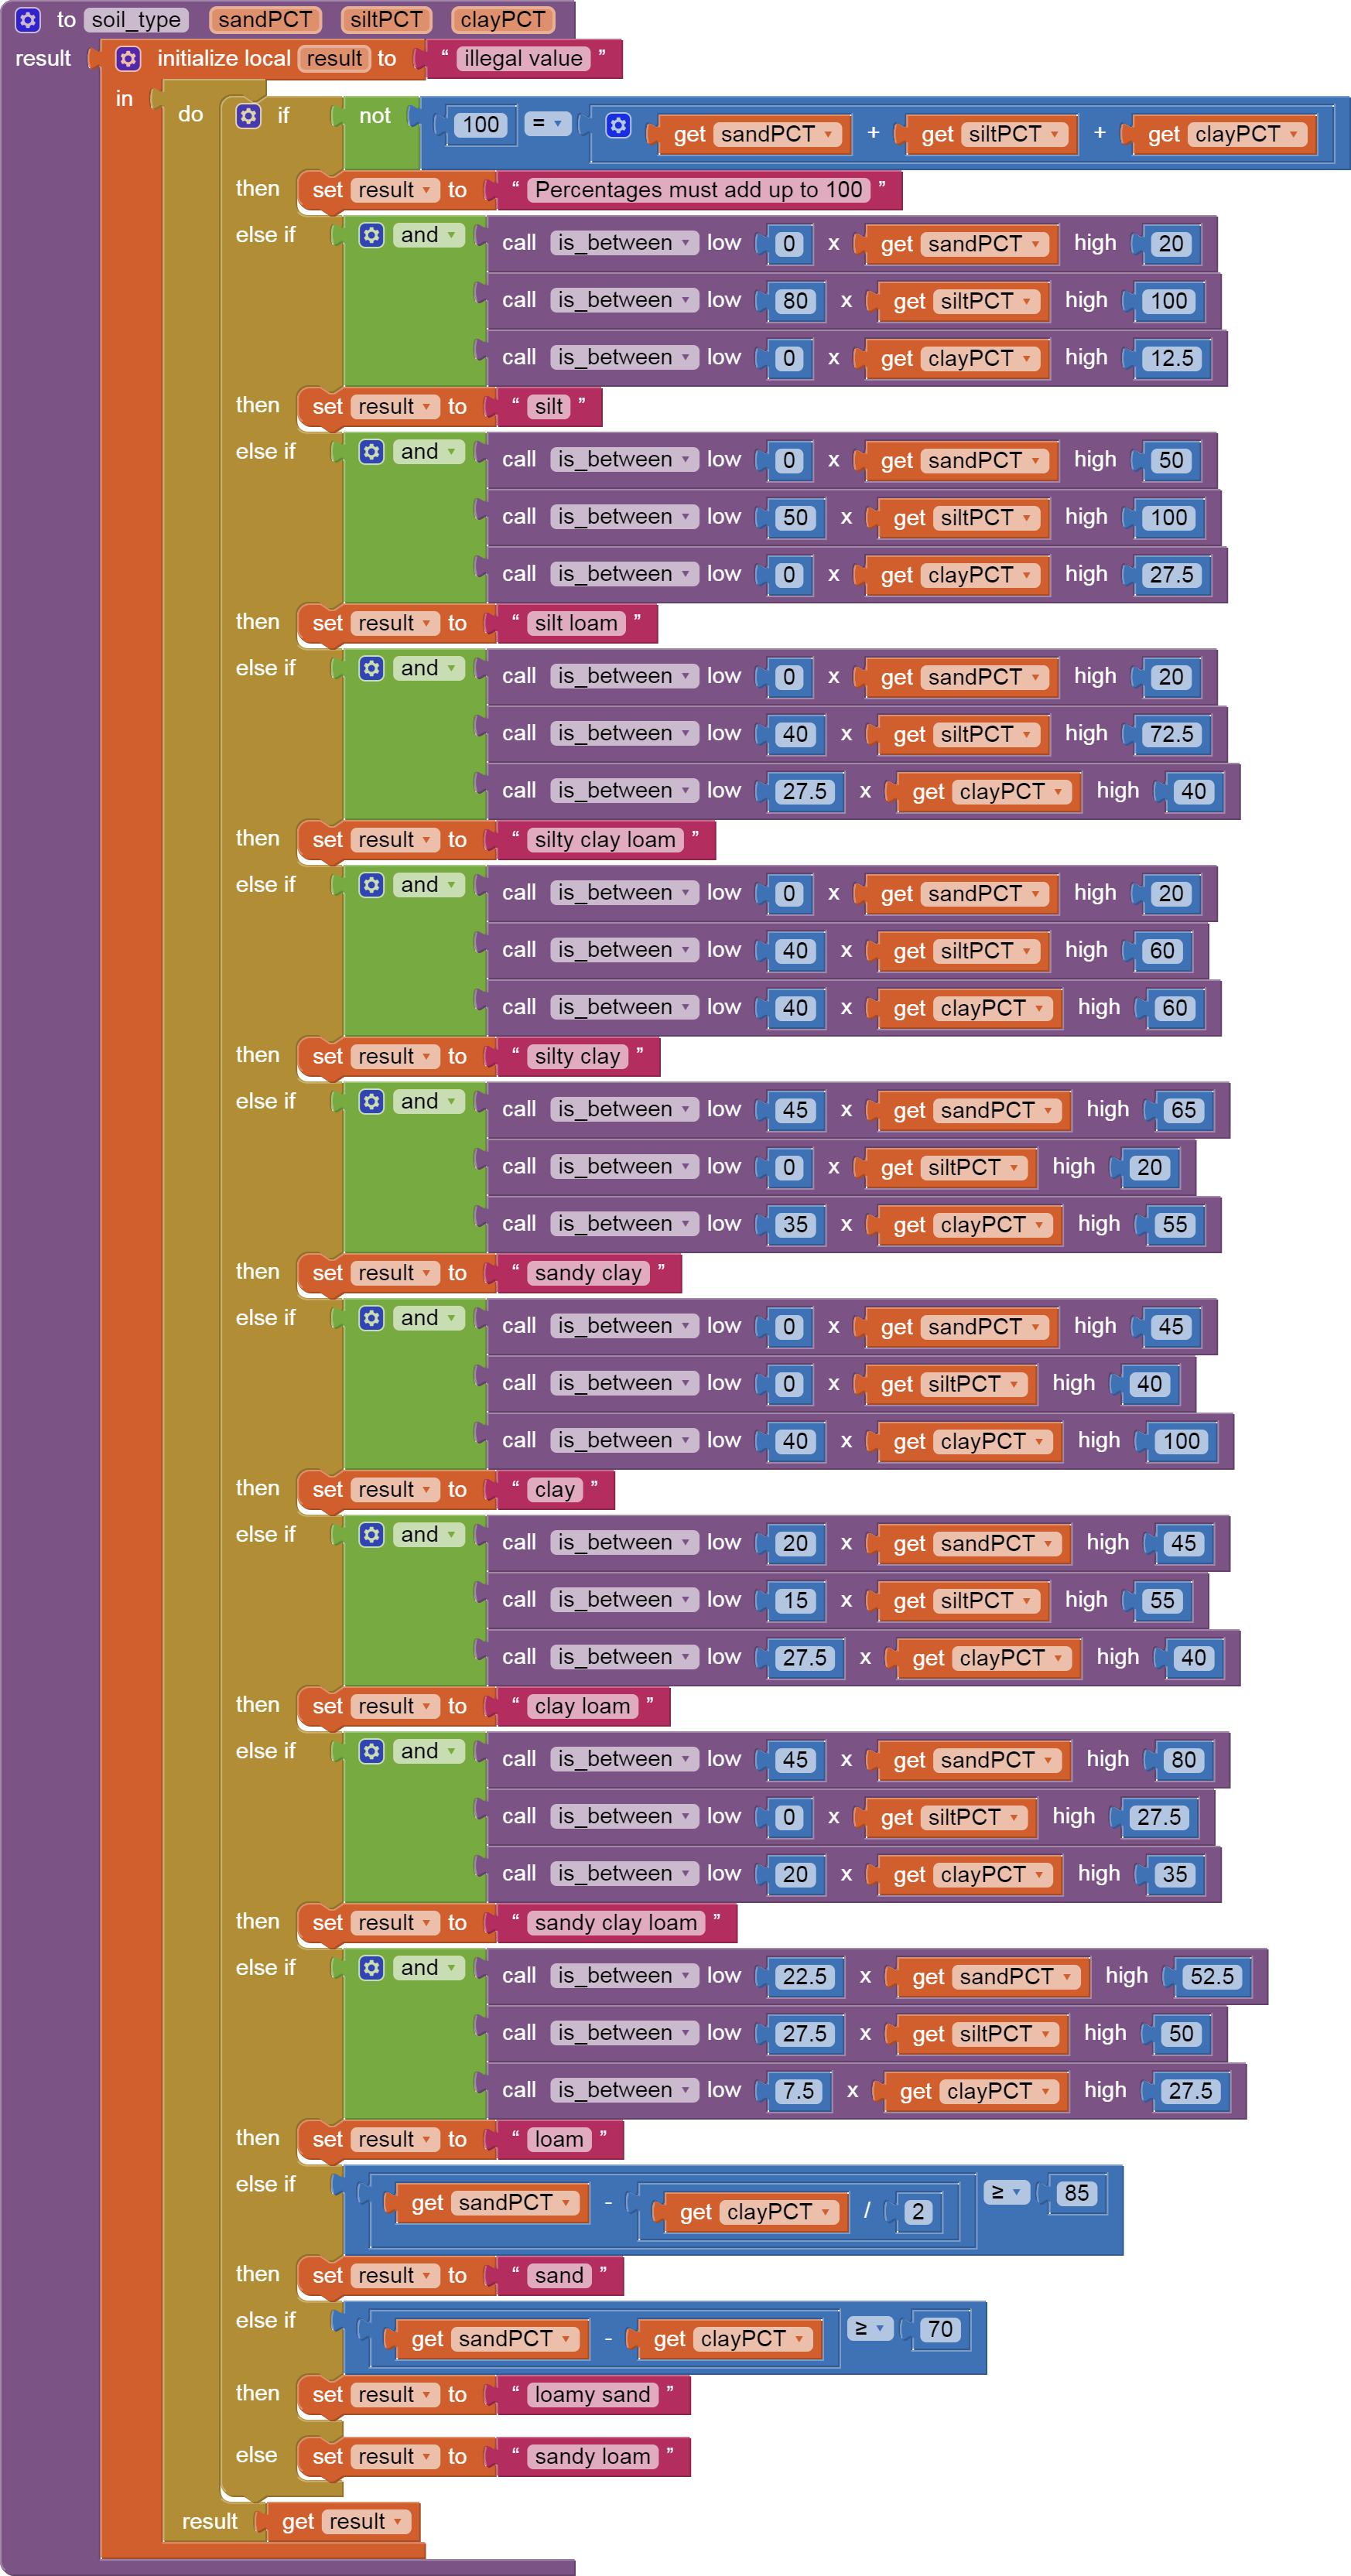
This will be an if/then/elseif with 12 branches, one for each colored area.
Each branch will nibble away at the choices available, to make subsequent tests simpler because of the earlier exclusion(s).
Some of the tests will include and/or clauses to respect the extra fences around areas with lots of edges.
Some of the tests will include proportional formulas, like loamy sand vs sandy loam, where a fence does not run parallel to one of the outer edges.
The order of the tests would probably correspond to the order of bites trying to eat a triangular cookie, if you use scissors instead of teeth, starting at the corners.
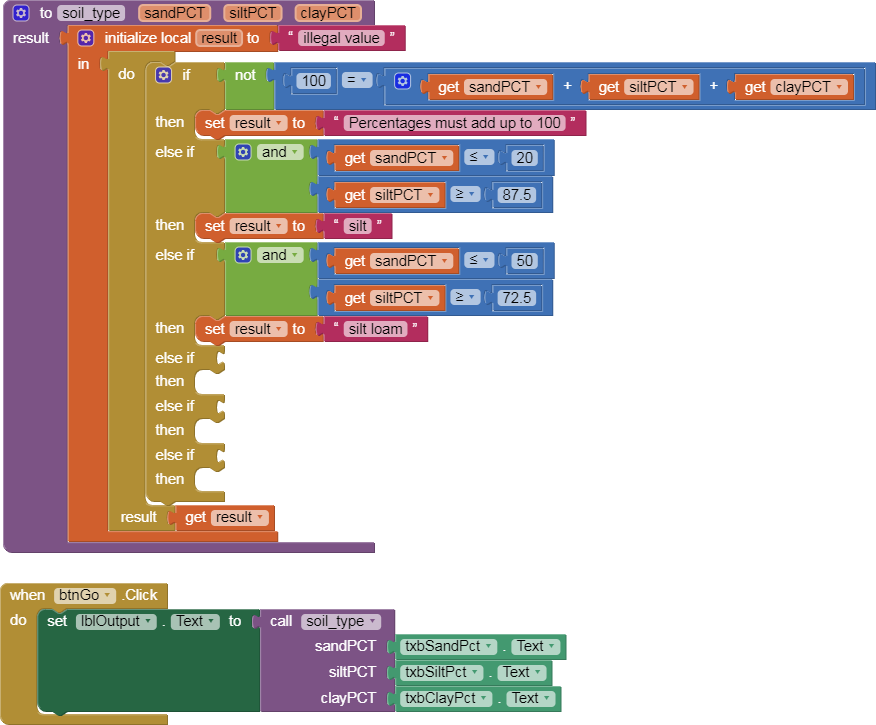
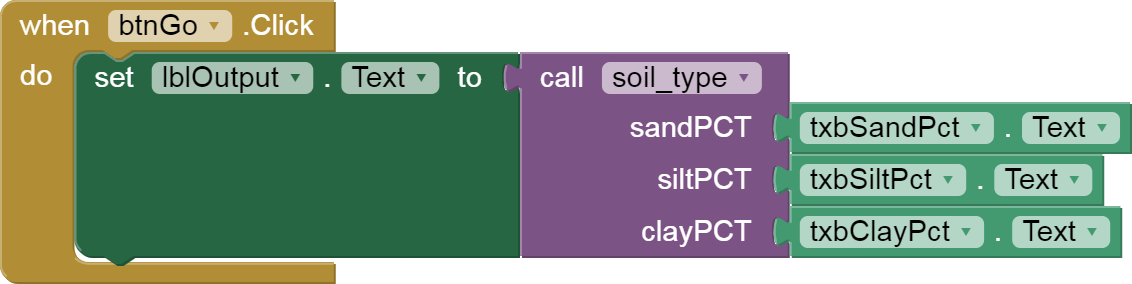
Here's a starter kit, with 2 soil types started for you.
I have to sleep on how to test against a fence that does not run parallel to one of the triangle sides.
That spreadsheet did not give up its inner secrets easily.
Here's a Google sheet upload of it, if you want to play online.
Those area boundaries with lines not parallel to one of the edges resemble linear functions on the x,y plane, ax + by = c at the boundary, where you have to extract the constants a,b,c from a picture of the line graph and two points on it. That's a standard high school algebra problem.
We will now pause for our high school algebra to bubble up from deep memory.
1 Like
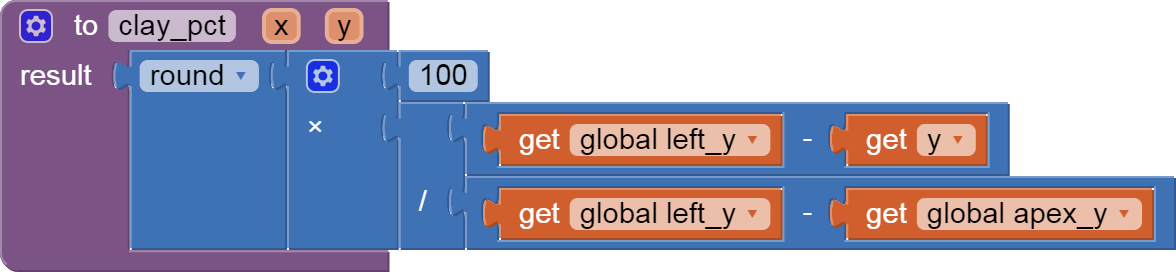
I figured out how to bring the sandy corner back into the realm of linear algebra over two variables.
(editted to use proper axes 11/26/2020 - ABG)
The sandy corner is at the intersection of two axes:
- clay (x)
- sand (y)
The sandy border line has 2 endpoints (x,y)=(clay,sand):
- (10,90)
- (0,85)
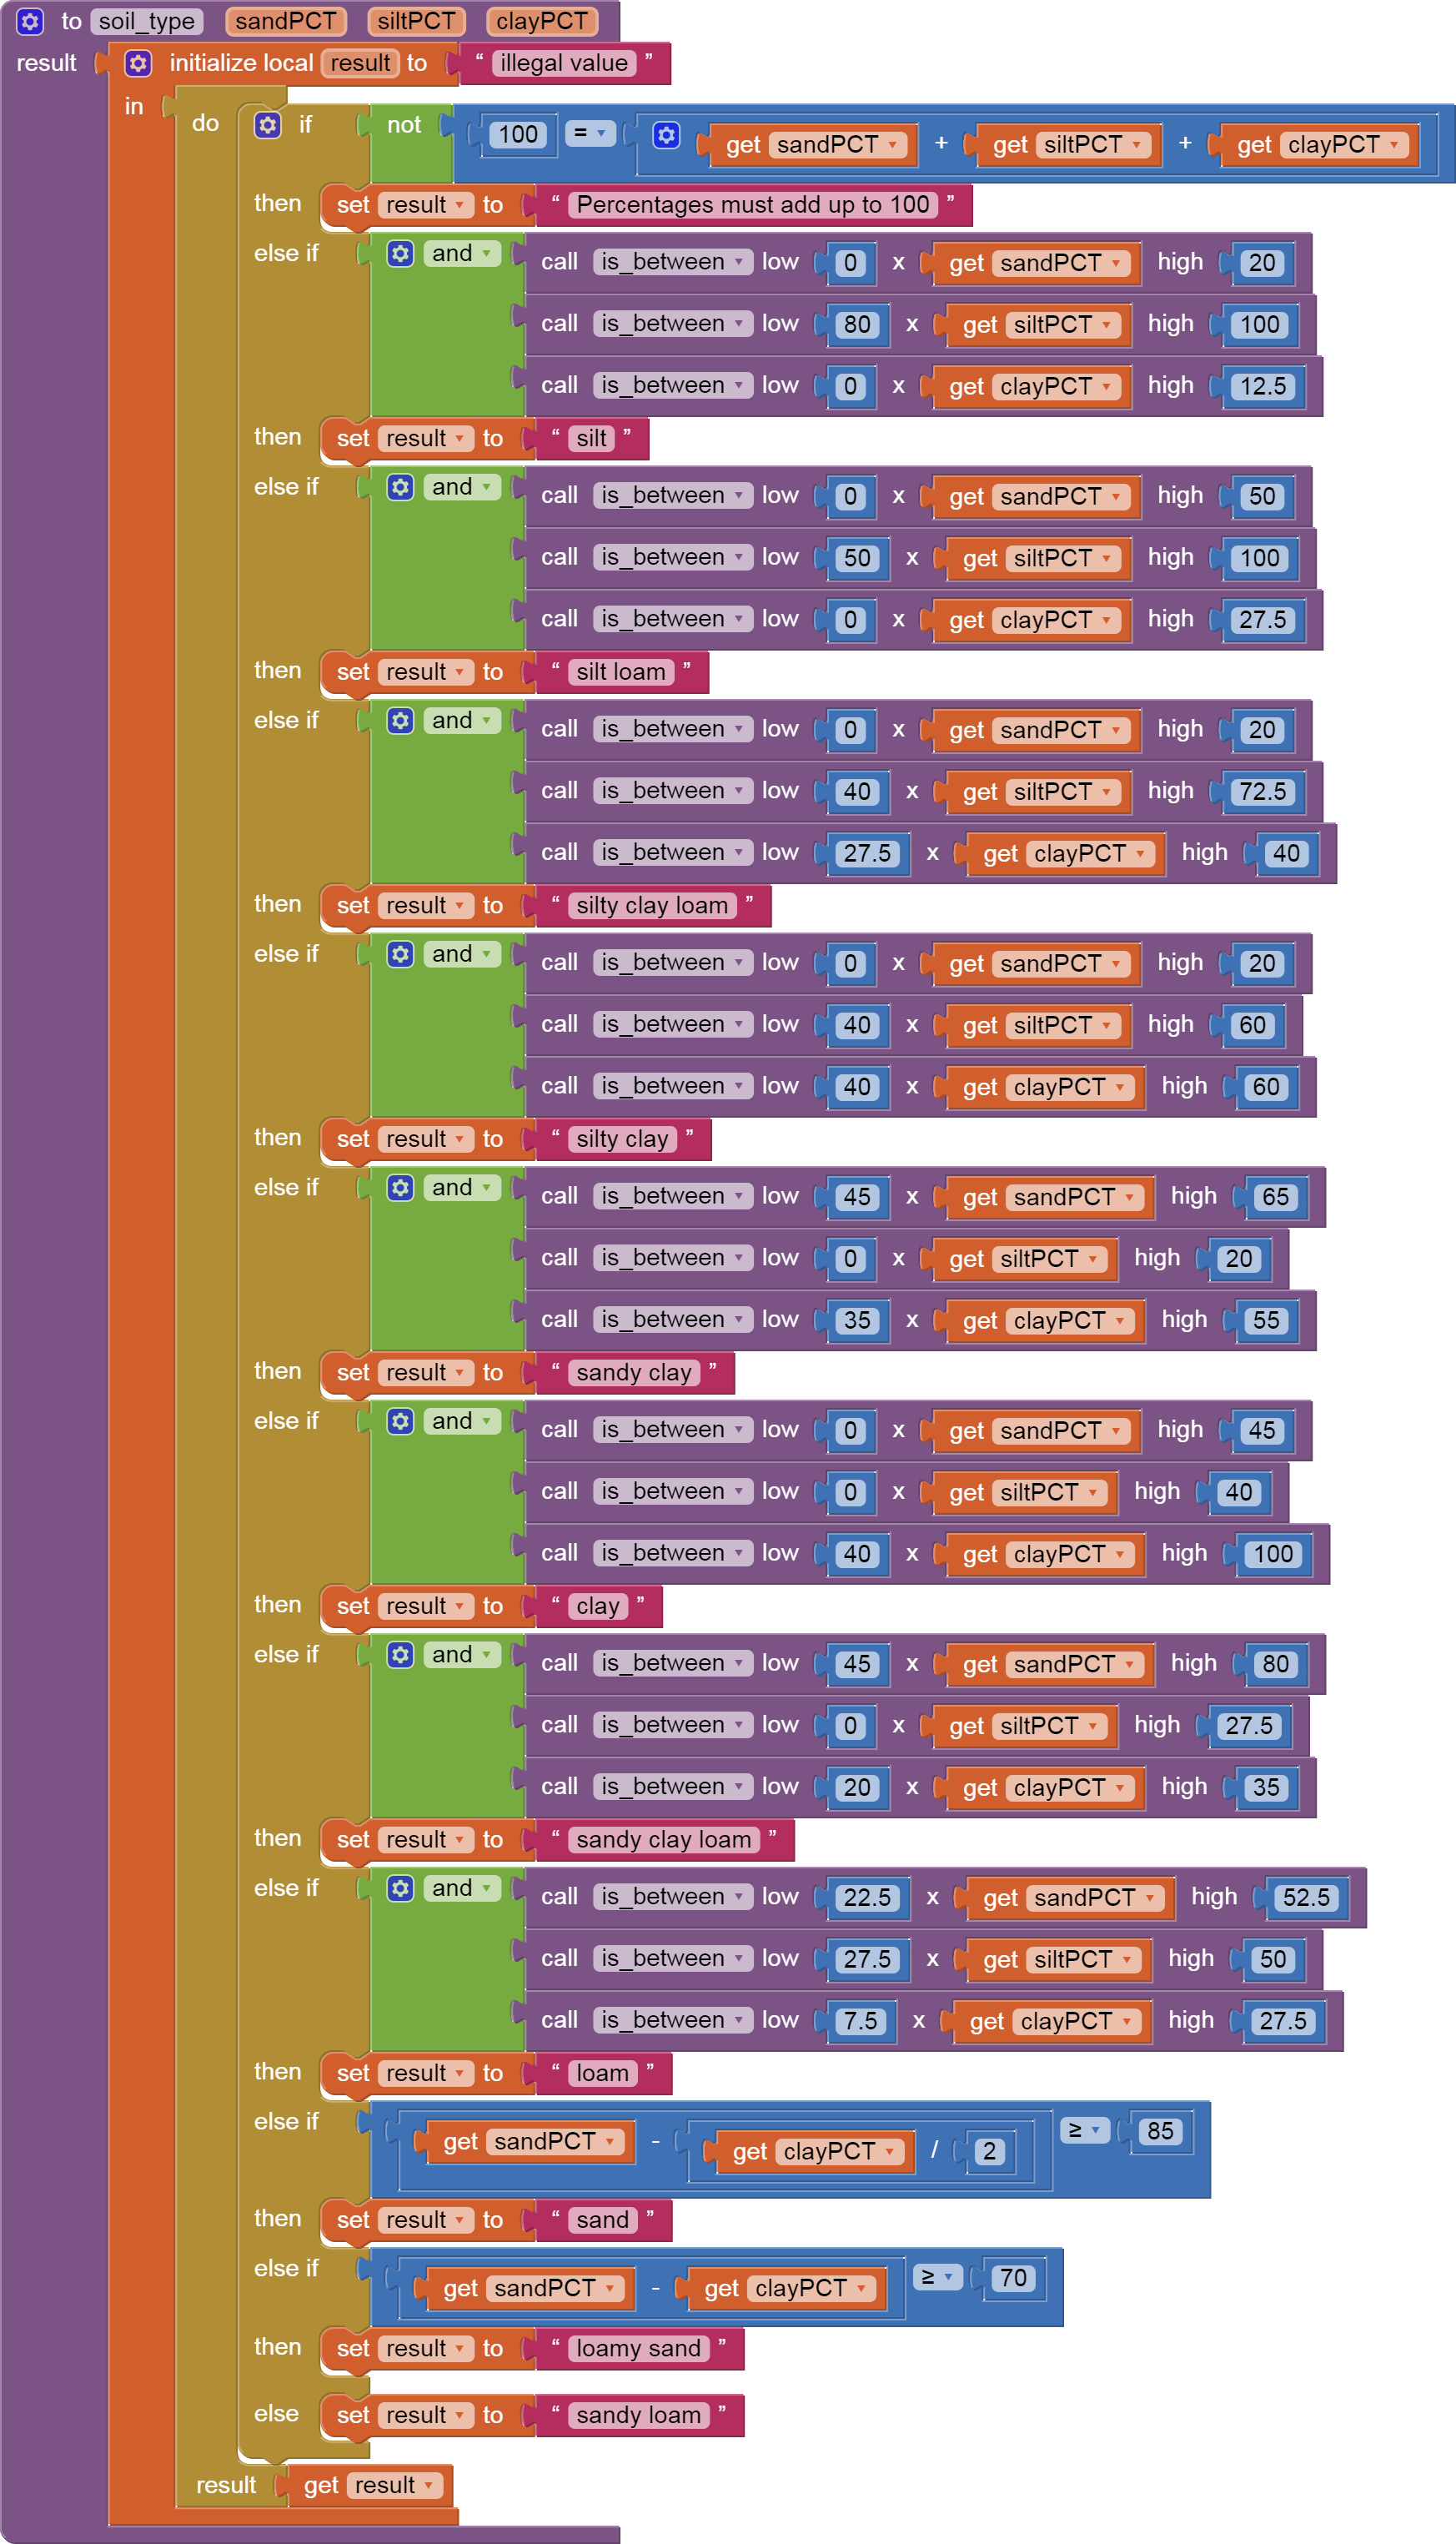
That would appear as a line with a slope dy/dx of +0.5, so the constant along the line would be (sand - clay/2) = 85. The sand section would have (sand - clay/2) >= 85.
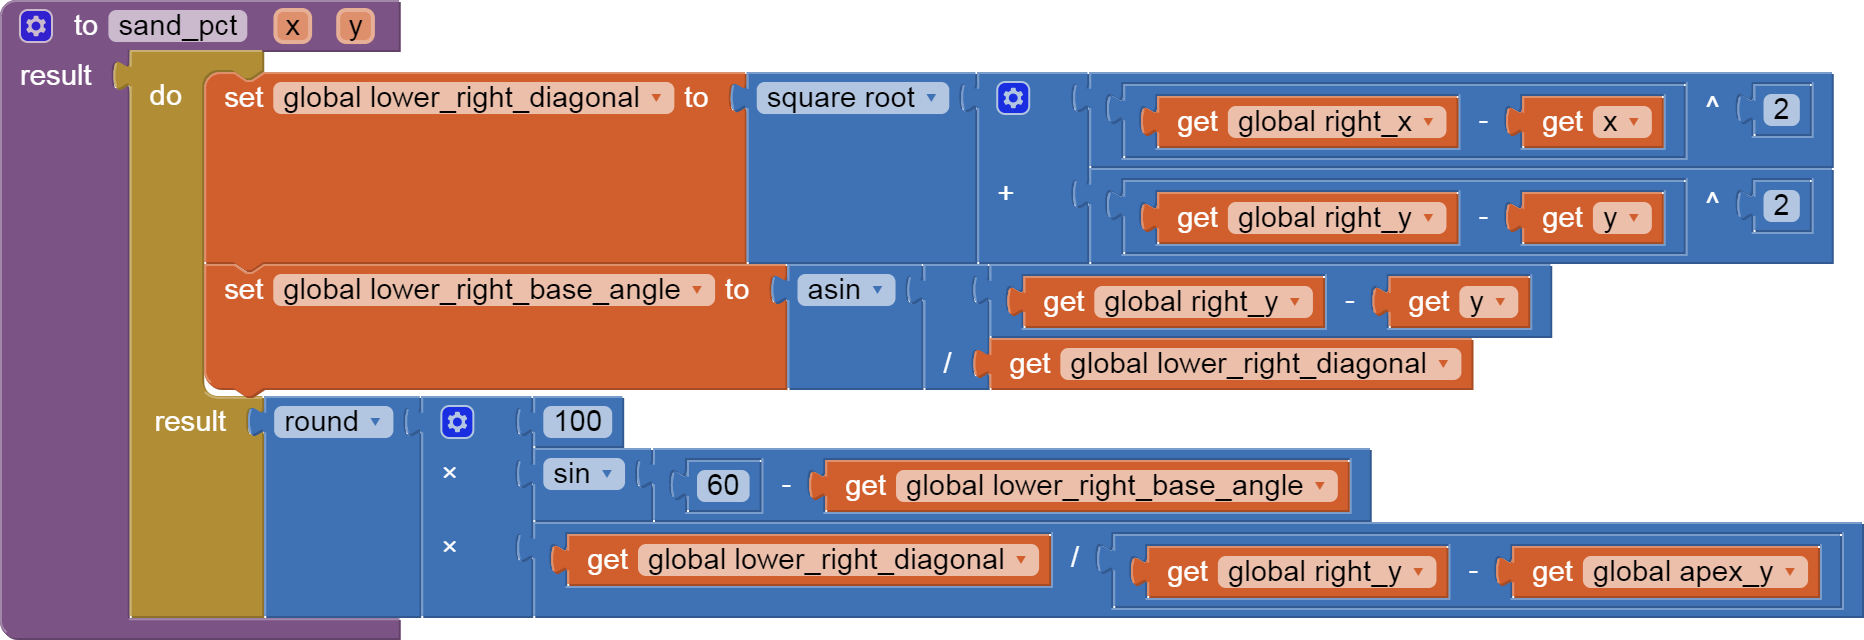
The loamy sand to sandy loam border has endpoints at (clay,sand):
- (15,85)
- (0,70)
That would appear as a line with a slope of -1, so the constant along the line would be
(sand-clay) = 70. The loamy sand section would have (sand-clay) >= 70 except for the sand section, already excluded.
the only section we haven't covered yet is sandy loam, so that catches the remaining points. (Check if I'm wrong).
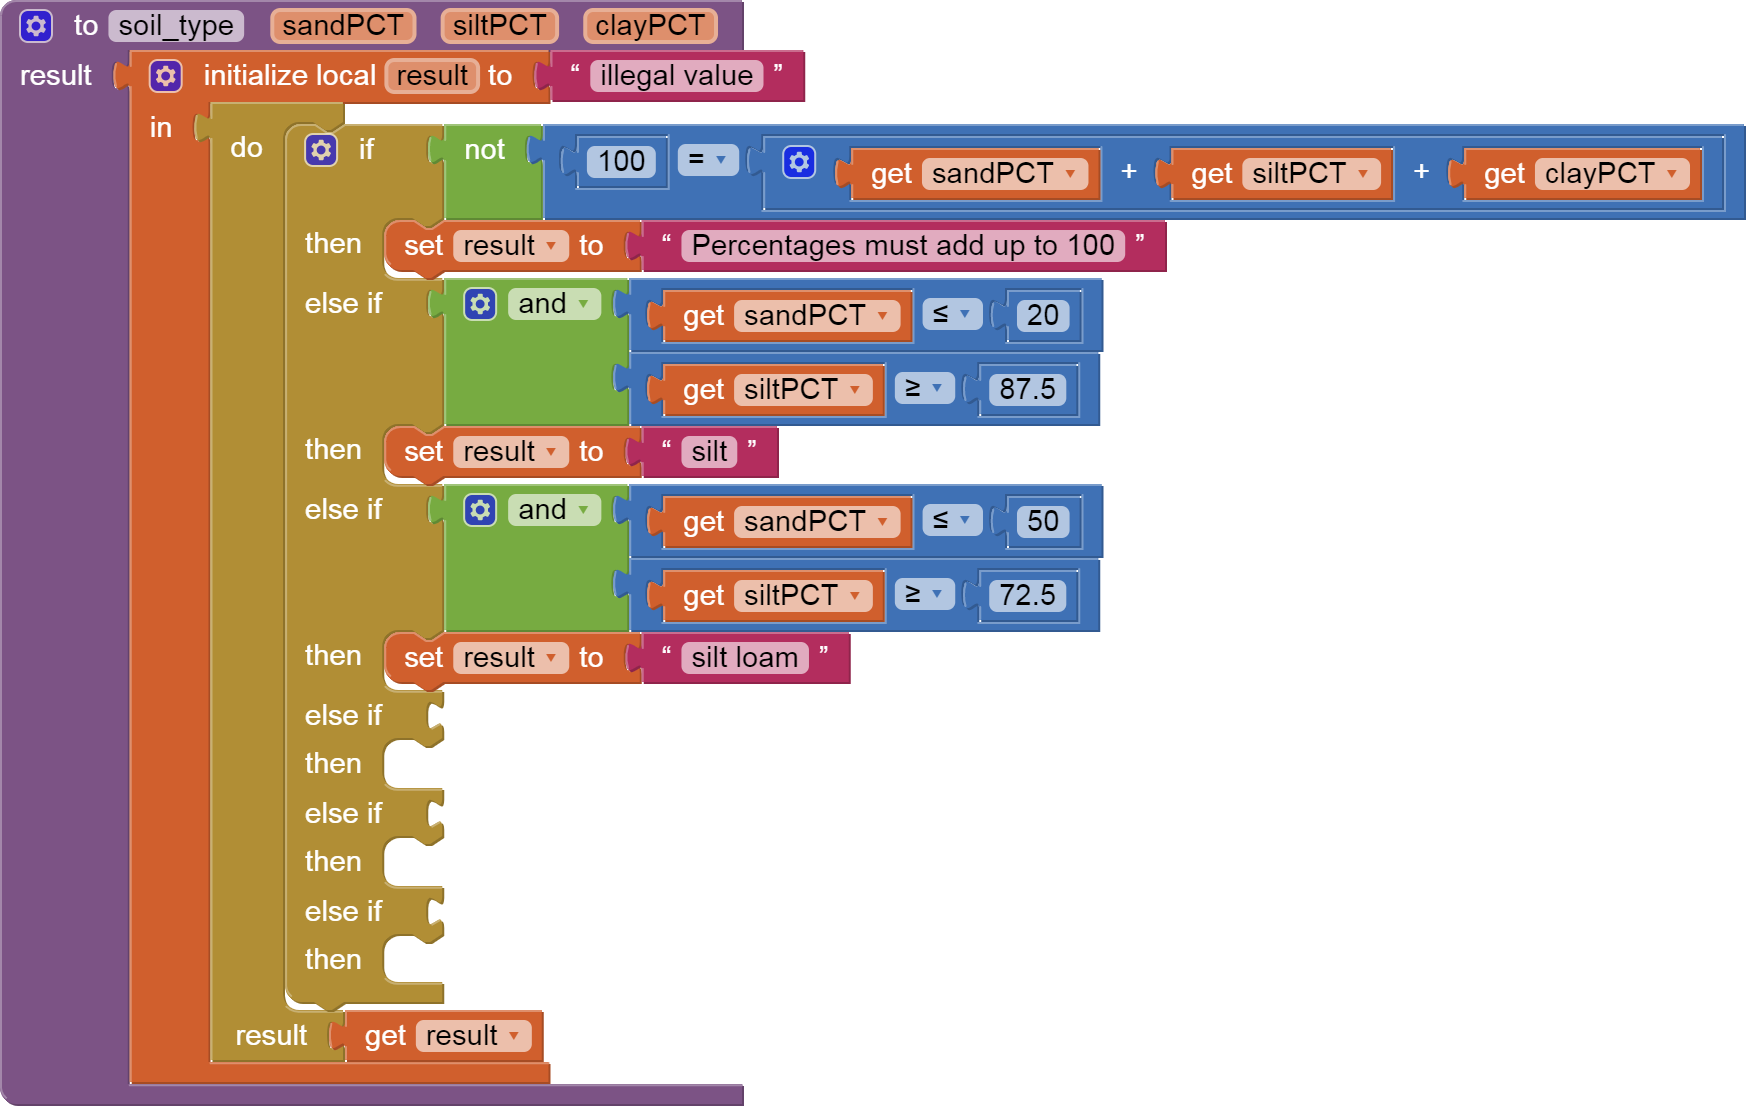
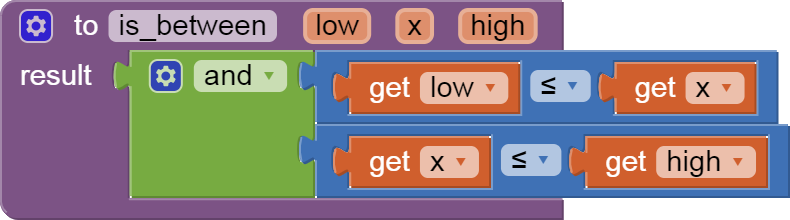
Revised blocks:
That completes the application.
1 Like
Postscript -
It helps to test your app before publishing it.
I needed to have included the apex of each triangular range in my tests, otherwise the earlier tests were grabbing points outside their domains.
Revised code to follow.
My apologies.
...Argh.
I just discovered I was reading the triangle chart wrong.
I should have read
The 3 axes are marked with numbers increasing by 10 from 0 to 100, but I wrongly assumed the isocline to follow from that number should head perpendicular to the origin of that axis.
That's wrong. The tilt of the numeric marker tells you which isocline to follow, the one in the same direction as the text of the isocline marker.
Time to redo my limits and algebra ...
Here's my final version, with a section I overlooked (clay loam).
sand_silt_clay.aia (7.1 KB) 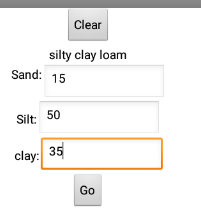
Given the repetitive nature of the tests, I should have done this as a table based app.
Hello >> Firstly, I thank you for your kind effort.
You have helped me a lot to accomplish my humble work

1 Like
Dear ABG.. I want to change the textures type from text to a sign in the triangle textures image .. What is the appropriate function .. Thank you
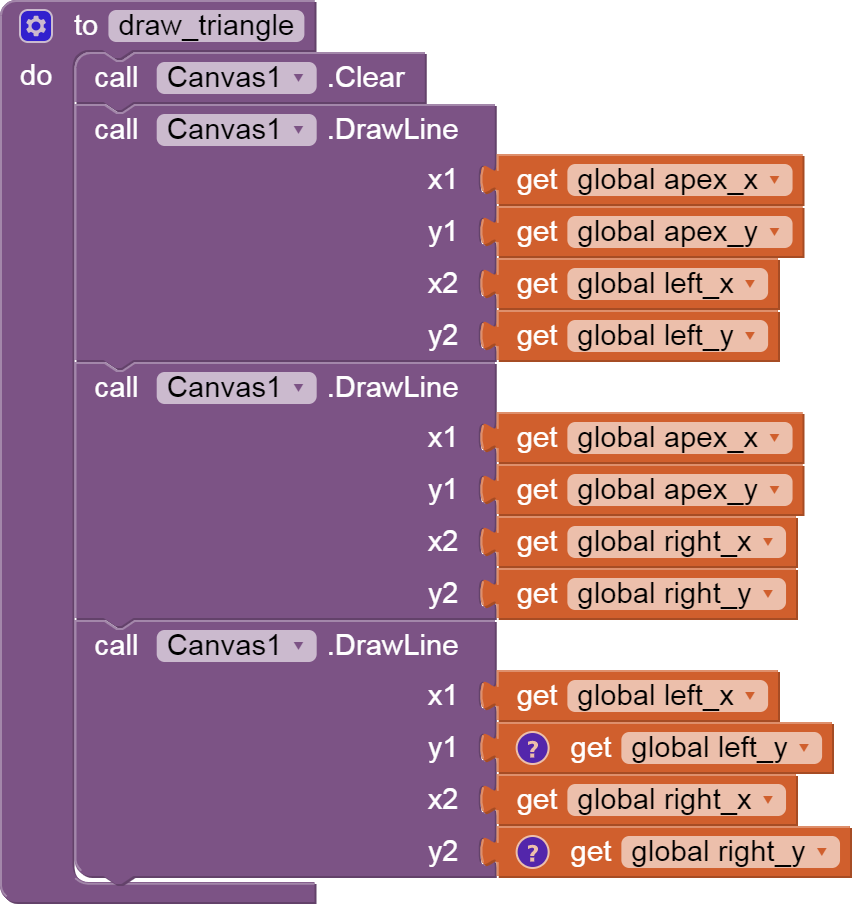
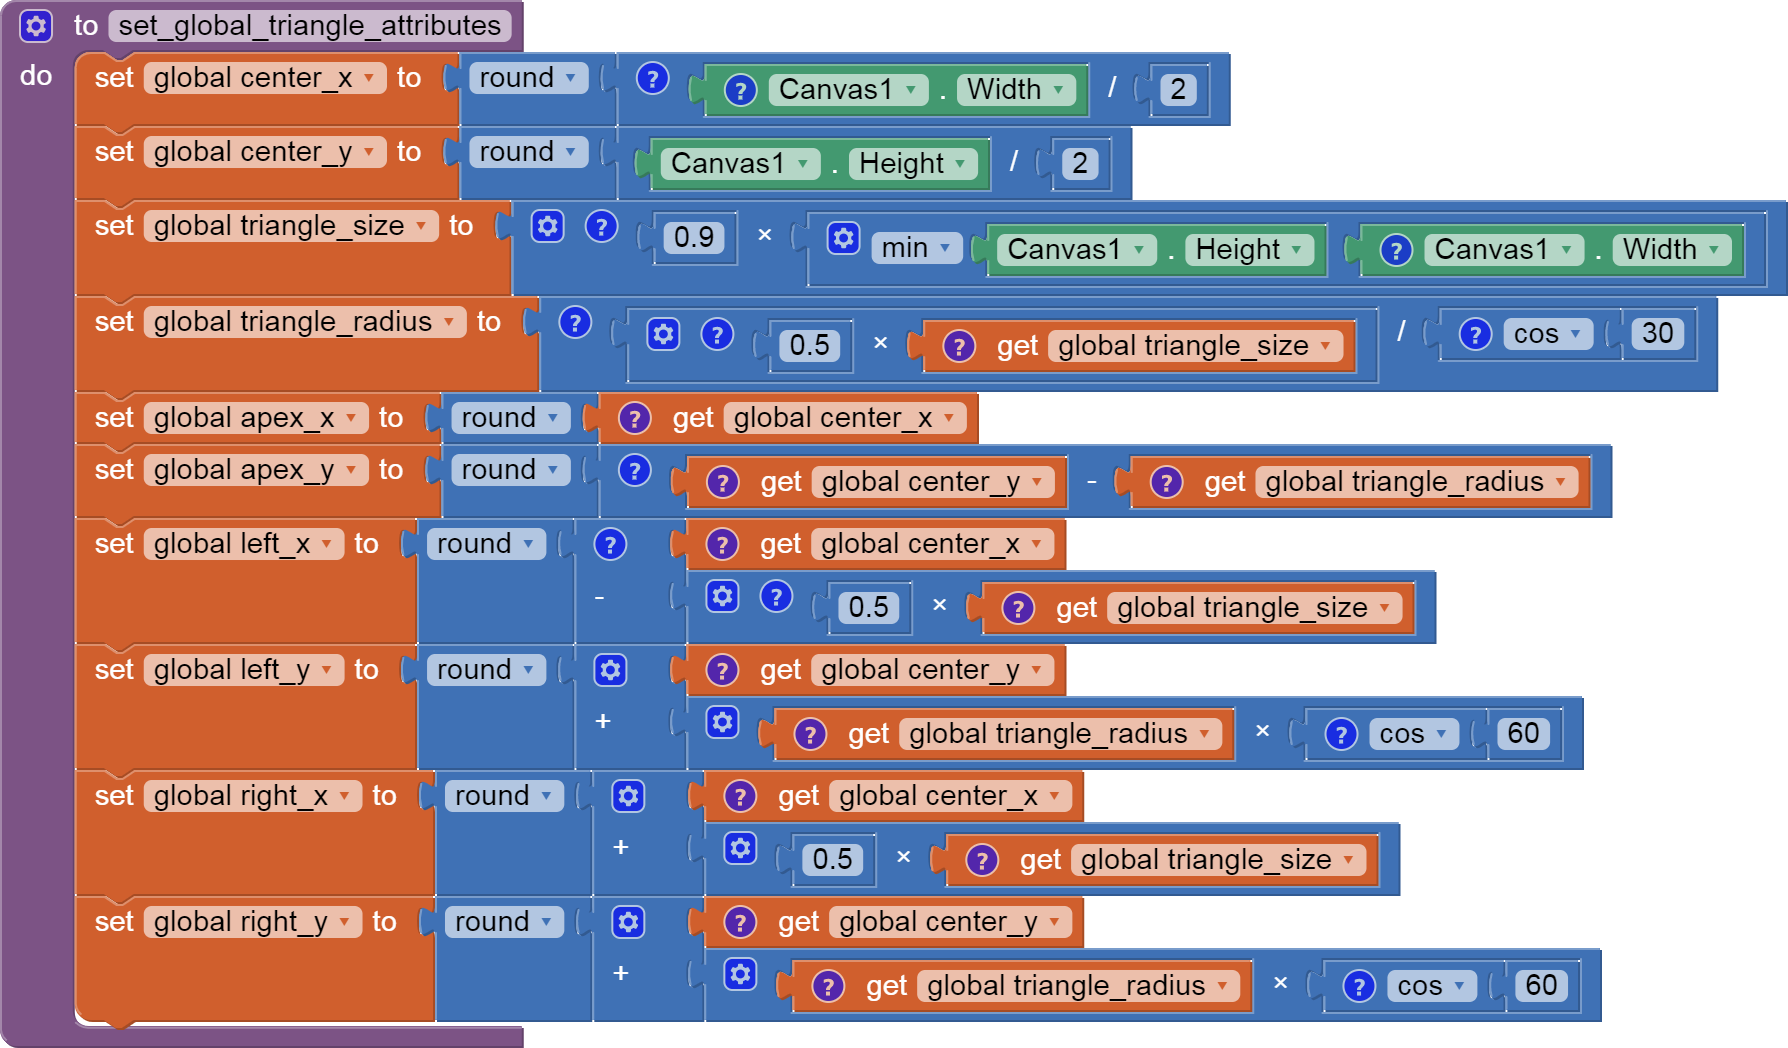
I had tried this, and got stuck on the math somehow.
I thought I had reasonable geometry, but when I ran a display of the triangle areas based on transformations of the (sand,clay, loam) points into (x,y) coordinates my triangle kept coming out skewed to the left.
I was able to go in the opposite direction, from (x,y) coordinates into (sand,clay,loam) coordinates, however, to crudely paint the triangle with colored regions.
But that wouldn't help you.
Here's as far as I got ...
sand_silt_clay.aia (18.0 KB)
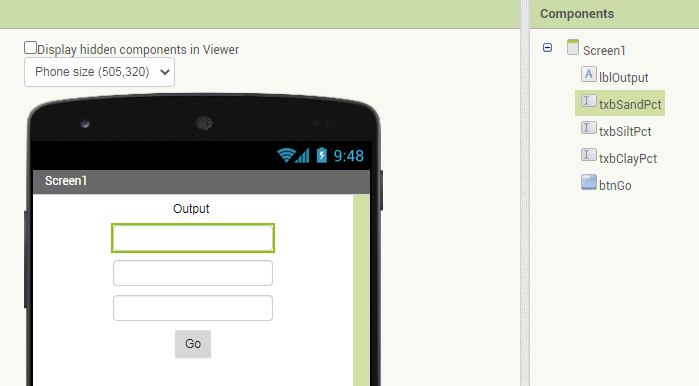
Is your second screen shot a program drawn Canvas, or a hand made mockup?
If you were able to draw it in blocks, you have solved the math problems.
Are you talking about the three perpendicular lines from the red dot to the three sides of the equilateral triangle?
I would draw a big red Y with equal 120 degree angles onto a clear background, and use it in a Sprite instead of that red ball. Detect the white background surrounding the triangle as a barrier to keep the center of the Y within the colored triangle background when dragging the Sprite.
Further thoughts on the 3 perpendiculars to the triangle sides.
You could make 3 thin Canvases, one each on the right of their corresponding label (sand/silt/clay), extending to the right. As the red dot is dragged, get the percentages for each material, and refresh each material canvas with a proportional line.
On Touch Up of the drag, snap a picture file of each of the 3 canvases, and assign them to 3 rotatable sprites touching the red ball, like the second, minute, hour hands of an analog .
clock. Point the rotatable sprites to the 10 AM, 6 AM, 2 AM directions.
If you set up the right proportions, those should be your perpendiculars.
from https://www.linkedin.com/pulse/historical-development-usda-textural-triangle-madjid-mehrdoost
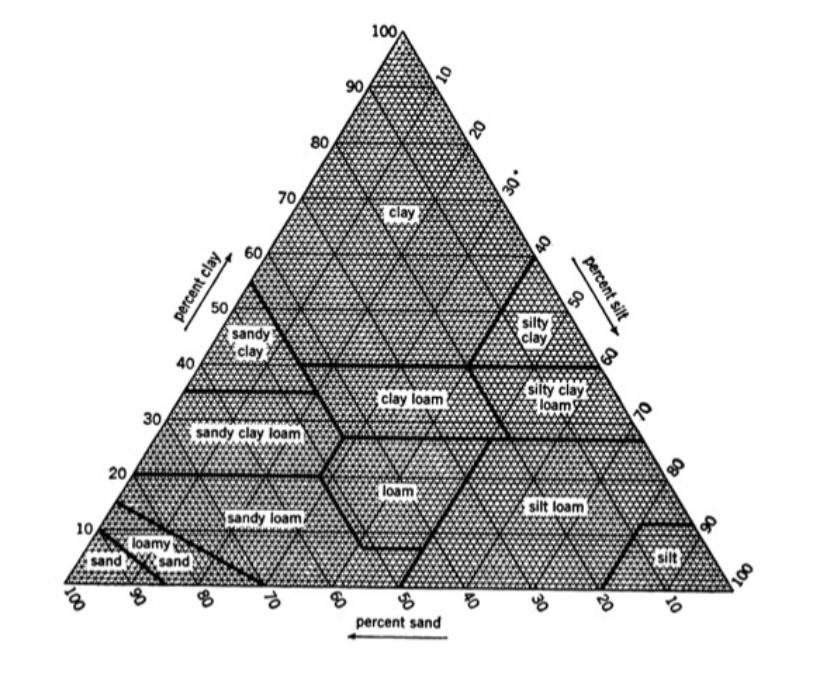
and a repost of data already provided https://www.nrcs.usda.gov/wps/portal/nrcs/detail/soils/survey/?cid=nrcs142p2_054167 The site links to an excel spreadsheet that contains appropriate algorithms to determine a classification based on %sand, %silt and %clay. Recreate the excel Macro using Blocks and you have your solution @Mohamed_Boabass . If you notice, the algorithm uses the same ternary diagram you posted Mohamed.
1 Like
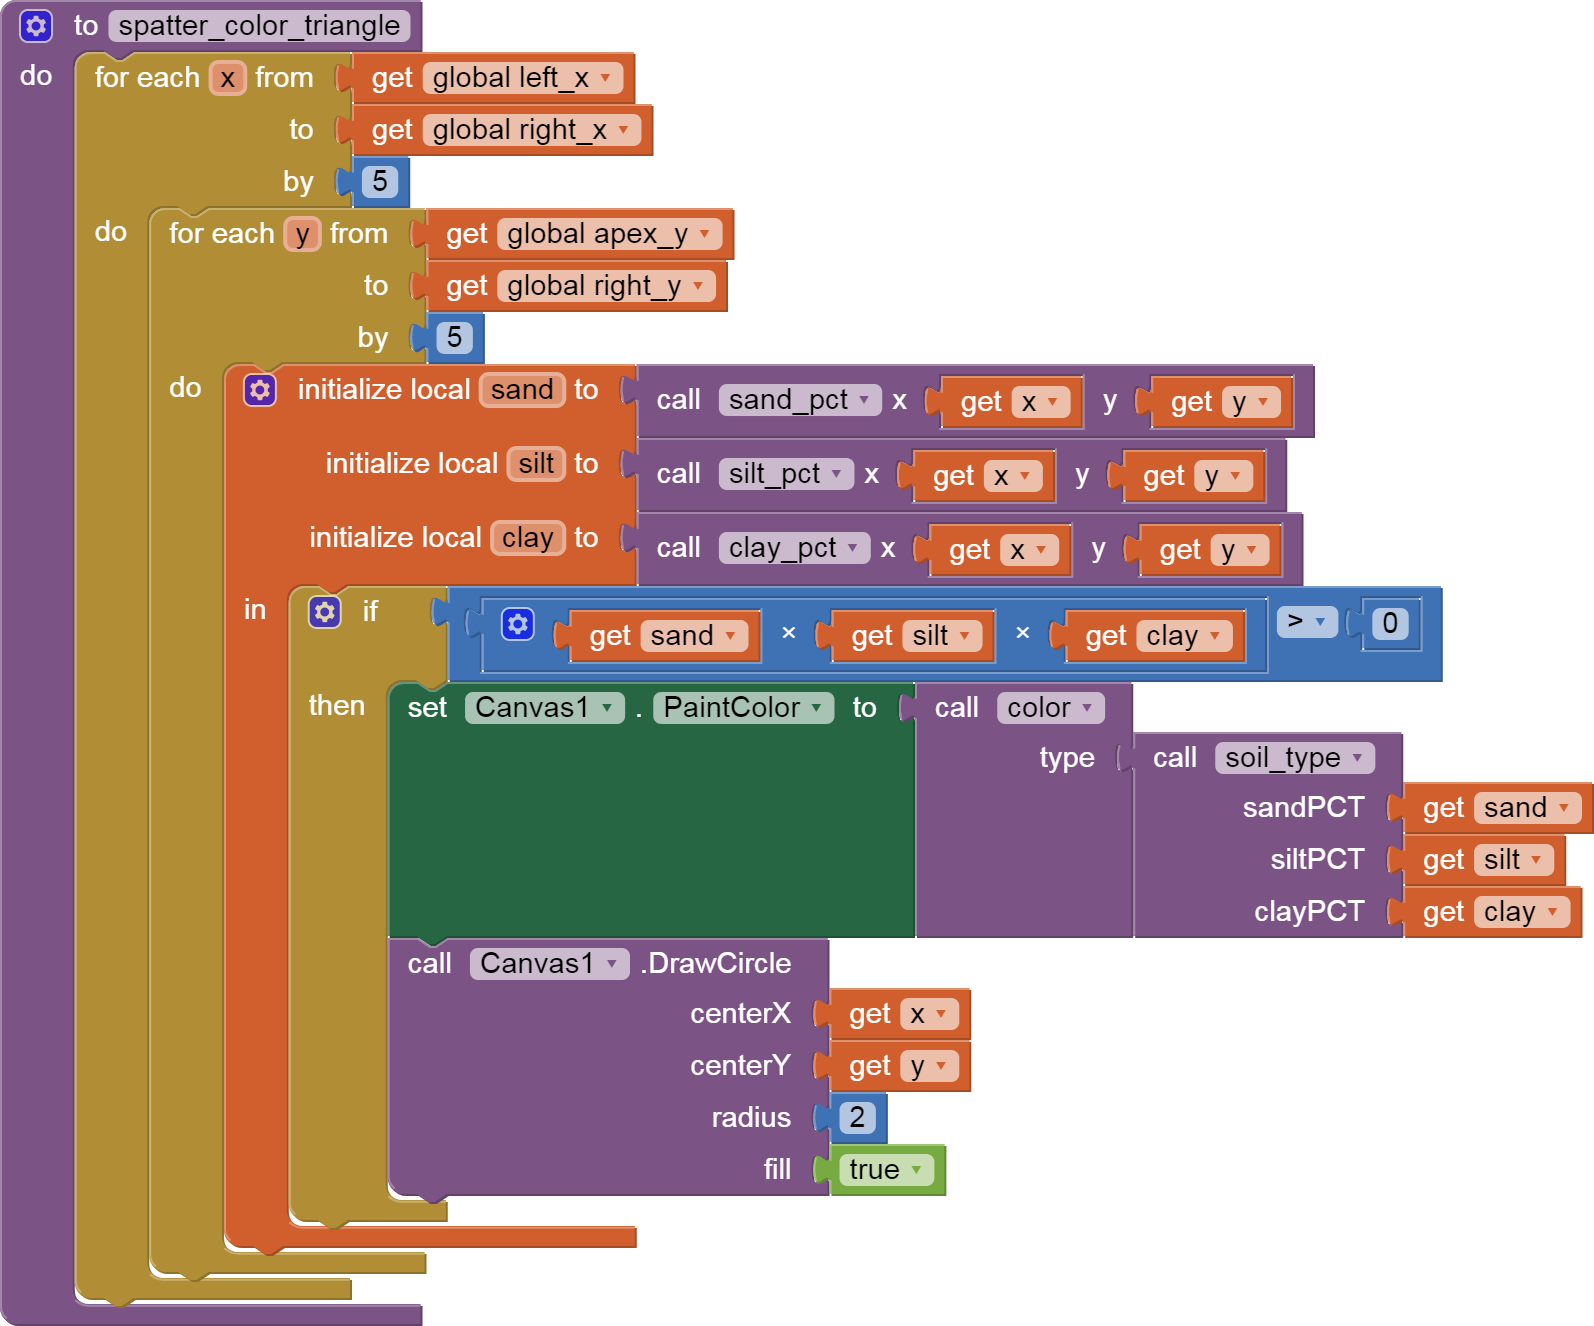
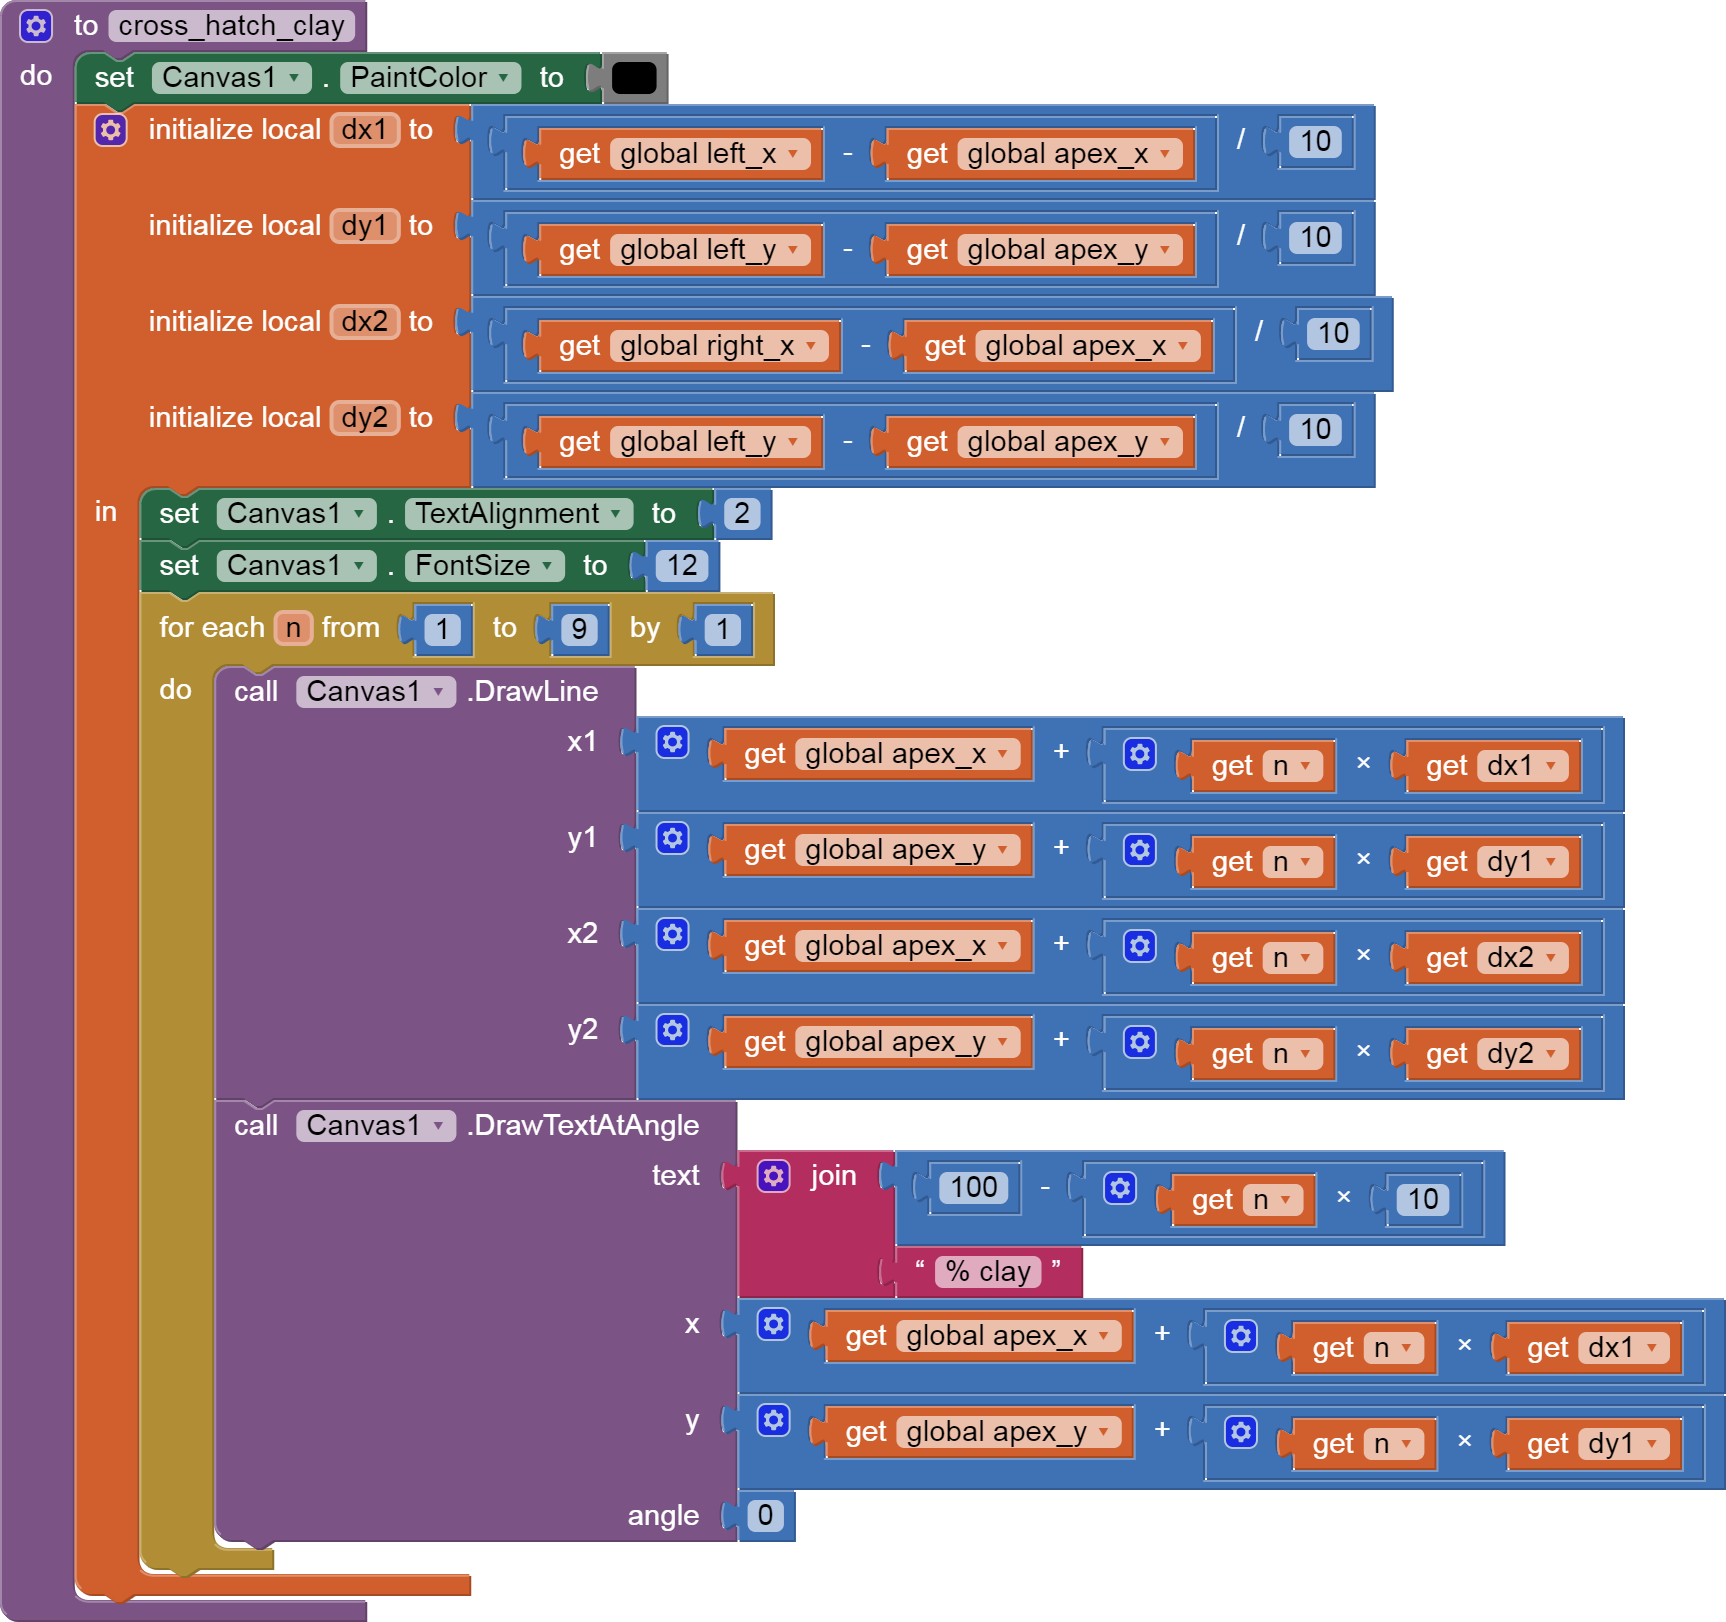
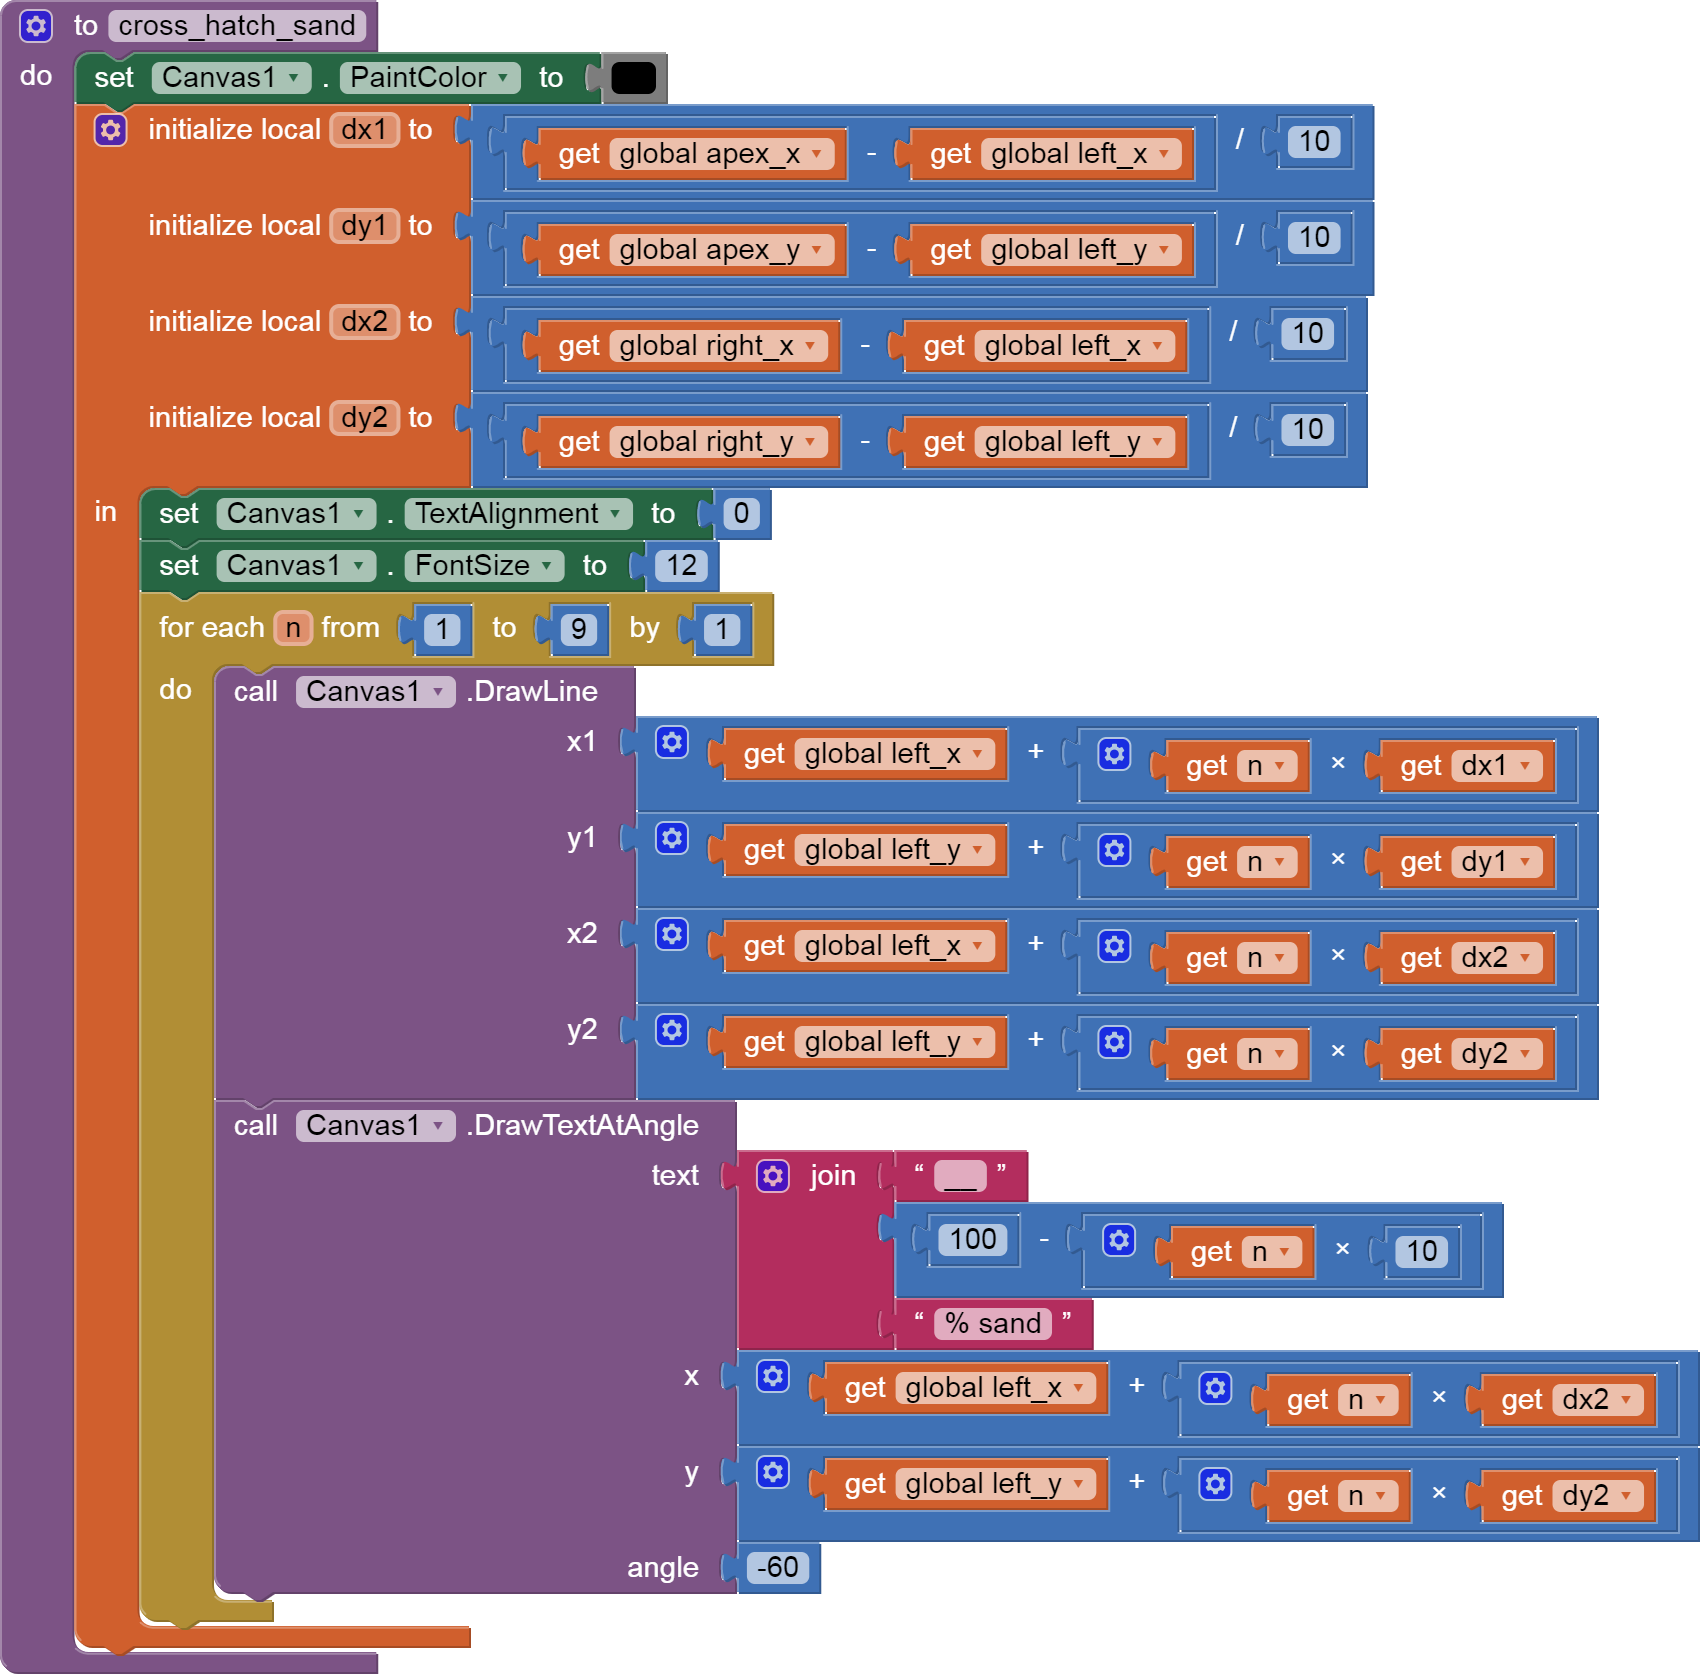
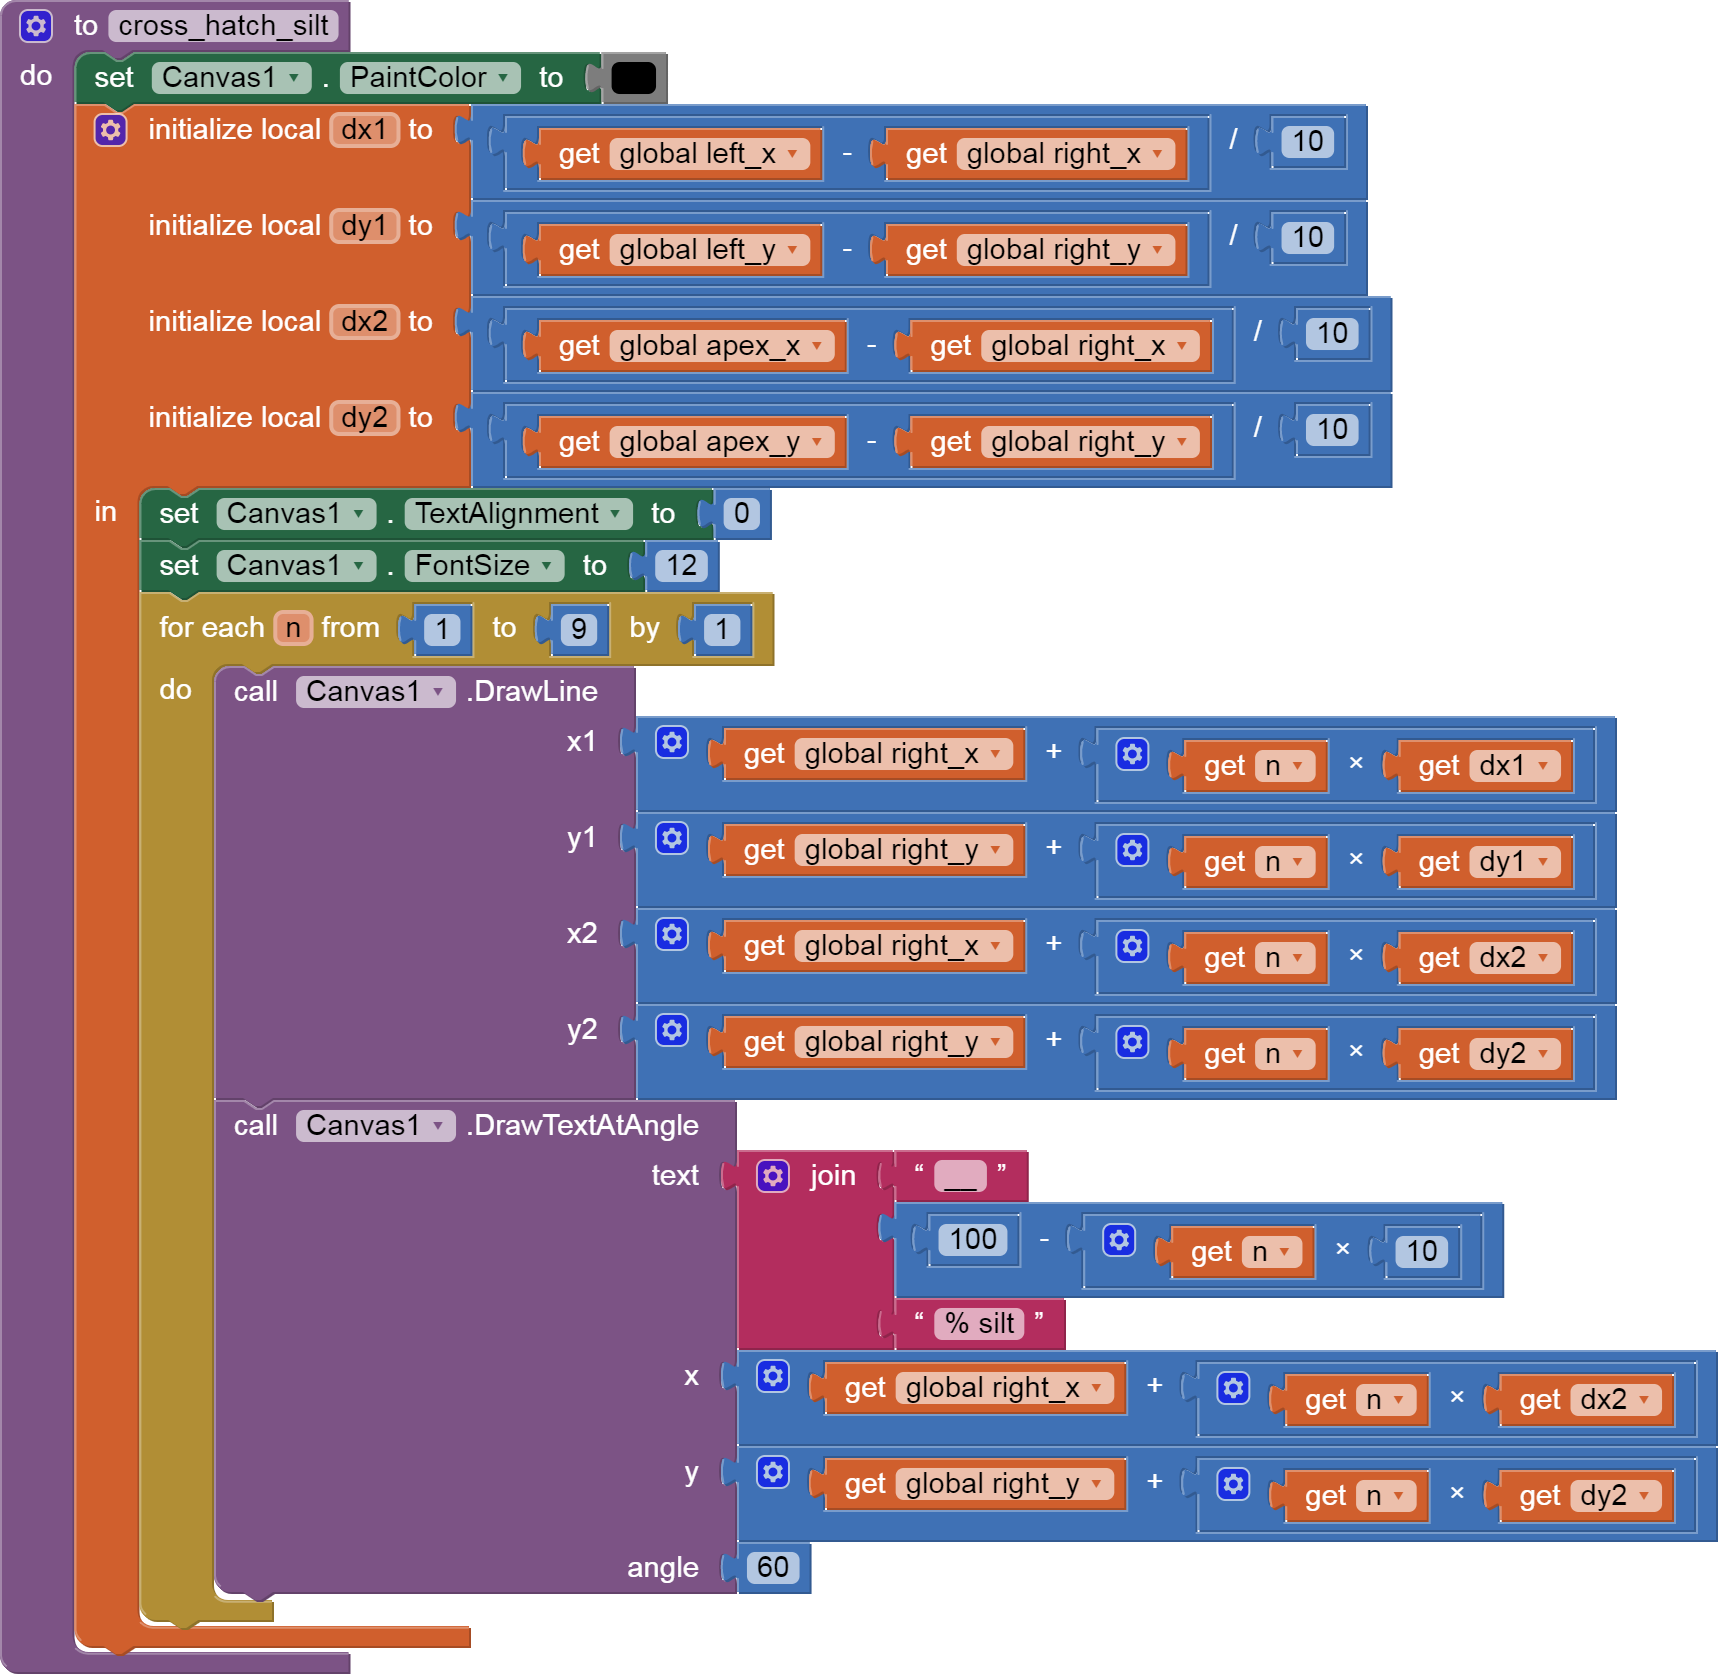
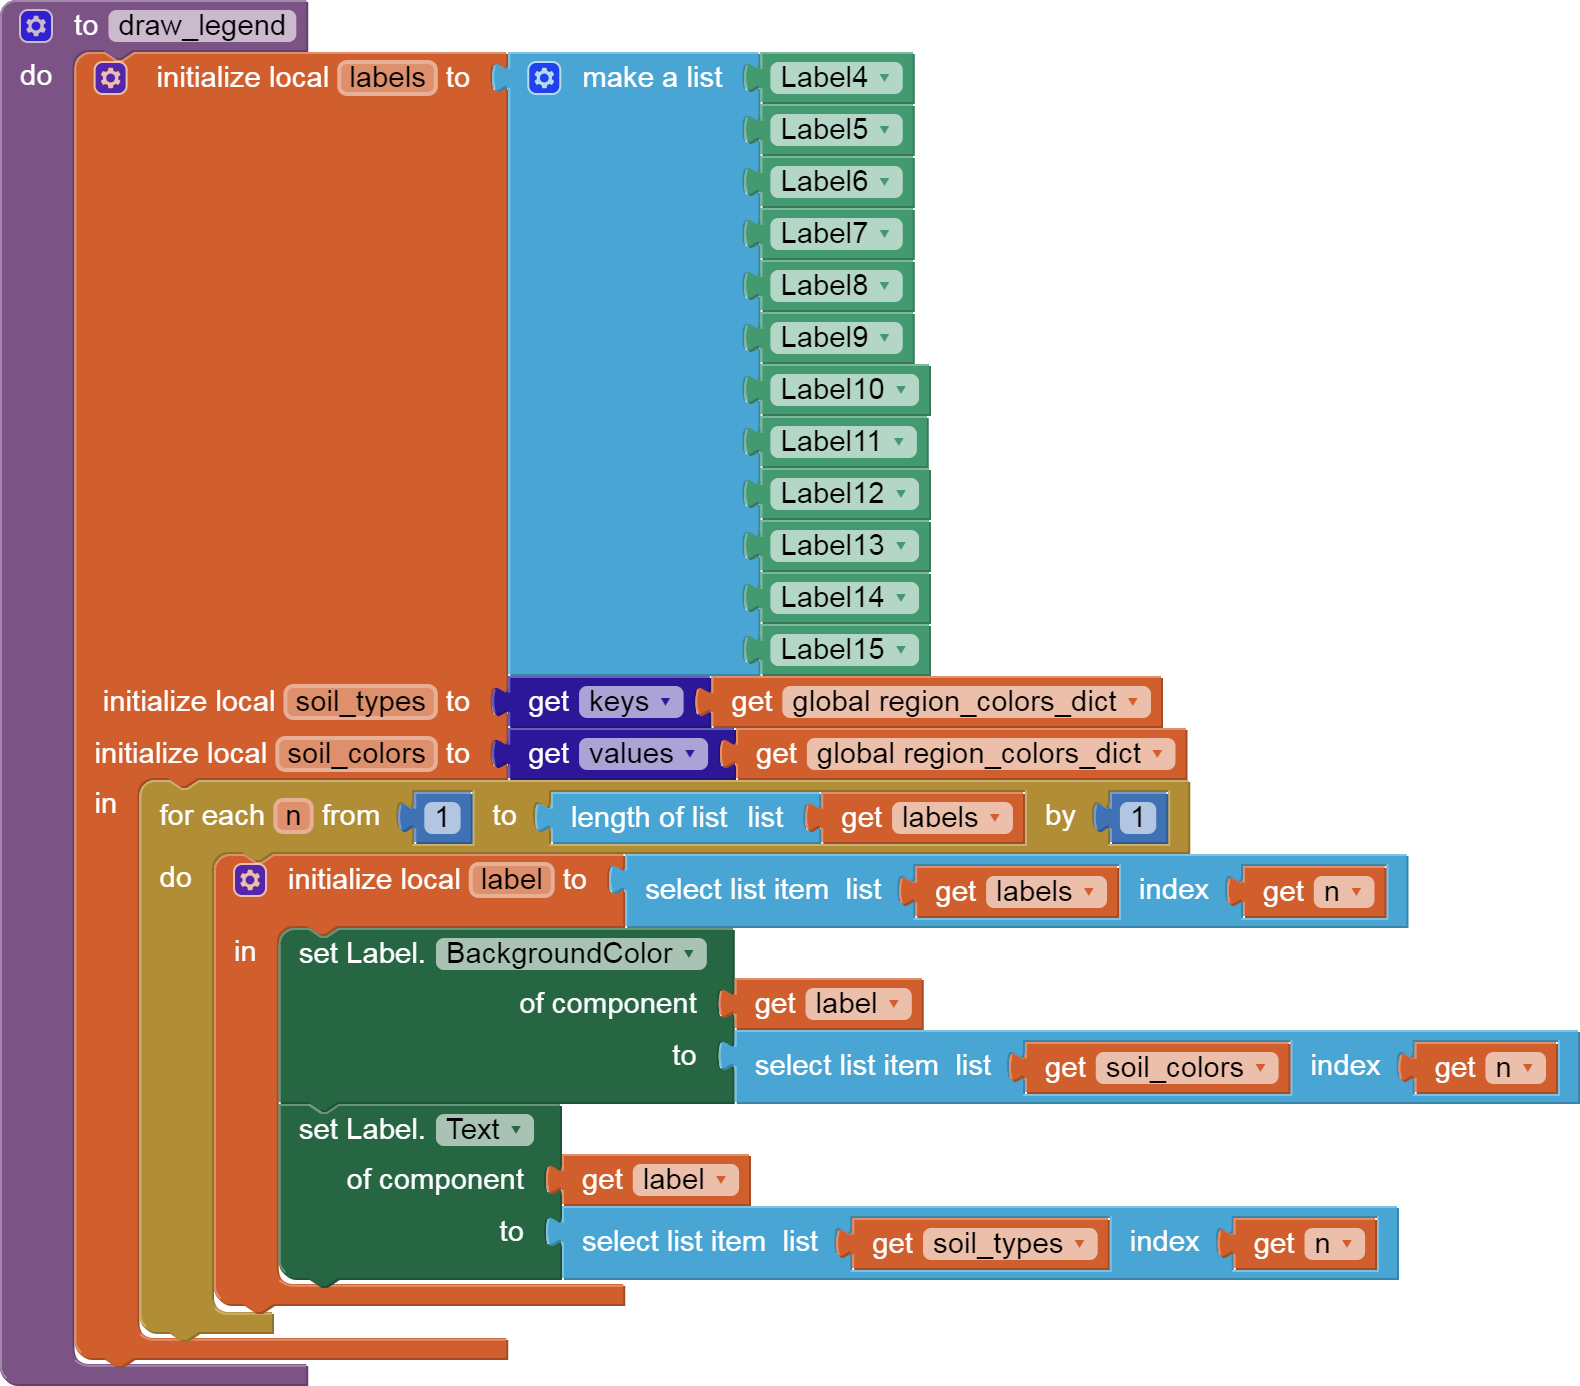
Here is a graphically nicer version, with spatter colored regions and cross hatching rulers.
The coloring would have gone faster had I been able to invert my two coordinate systems to get (x,y) from (sand,silt,clay).


6 Likes
Wow. I not thinked, that someone make it.
1 Like