Hello with thunkable it's pretty easy to post and receive a message to the HTML Website.
How can we do this with MIT APP Inventor.
Message ? In what format, in what way ?
What Message ?
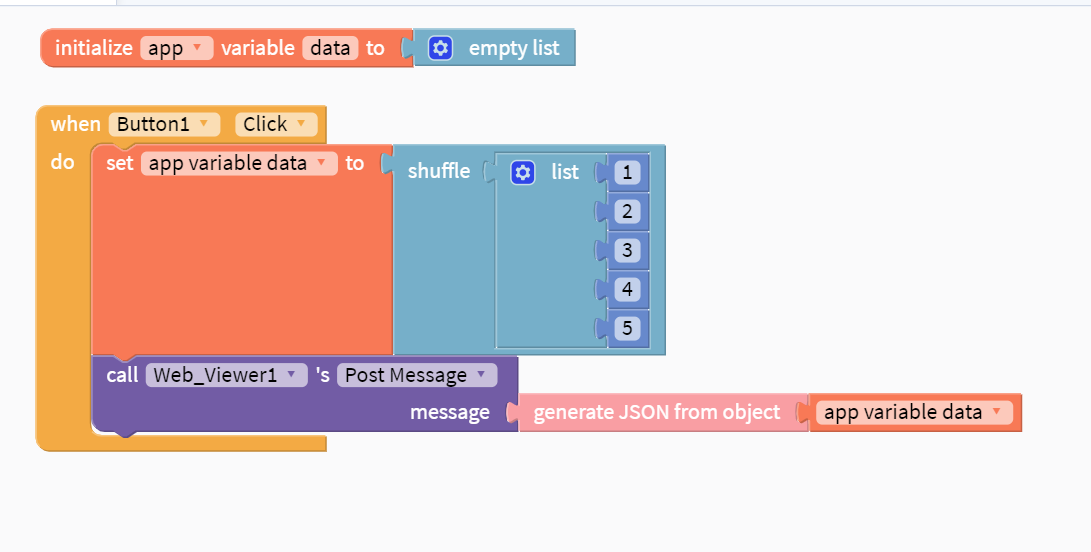
an Integer a Text message does it matter, the method is the same In tunkable we have a brick
Postmessage and ReceiveMessage. In the HTML File we receive the Message with
// when we get a message from the app, display it on the page
// message should be a JSON string of a list of numbers
ThunkableWebviewerExtension.receiveMessage(function(message) {
try {
var messageList = JSON.parse(message);} catch (e) { console.error("An error occurred. Message probably wasn't a JSON string of an array of numbers"); } drawChart(); });
Use web component-
Hello that is How I got it Thx Alpha 2000
This helped me a lot http://electrica.uc3m.es/grobles/blog/?p=1348
This is my HTML Code
But I don't understand how it gets it Data , how does it retrieves the data without an JavaScript handler, it works but I'm confused
> <html>
>  <head>
>  <script type="text/javascript" src="https://www.gstatic.com/charts/loader.js"></script>
>  <script type="text/javascript">
>  google.charts.load('current', {'packages':['corechart']});
>  google.charts.setOnLoadCallback(drawChart);
>  d = window.AppInventor.getWebViewString();
>  var array = JSON.parse(d);
>
> function drawChart() {
>  var data = google.visualization.arrayToDataTable(array);
>
> var options = {
>  title: 'Company Performance',
>  curveType: 'function',
>  legend: { position: 'bottom' }
>  };
>
> var chart = new google.visualization.LineChart(document.getElementById('curve_chart'));
>
> chart.draw(data, options);
>  }
>  </script>
>  </head>
>  <body>
>  <h1> Hallo dies ist ein Chart Test</h1>
>  <div id="curve_chart" style="width: 500px; height: 200px"></div>
>  </body>
> </html>
I append the aia File so you can fiddle Chart_Test.aia (6.4 KB)
Thank you MIT for this wonderful App
1 Like
I didn't understand you problem correctly can you please say it briefly
You can easily do that using SetWebViewString property.
Didn't notice that.
1 Like
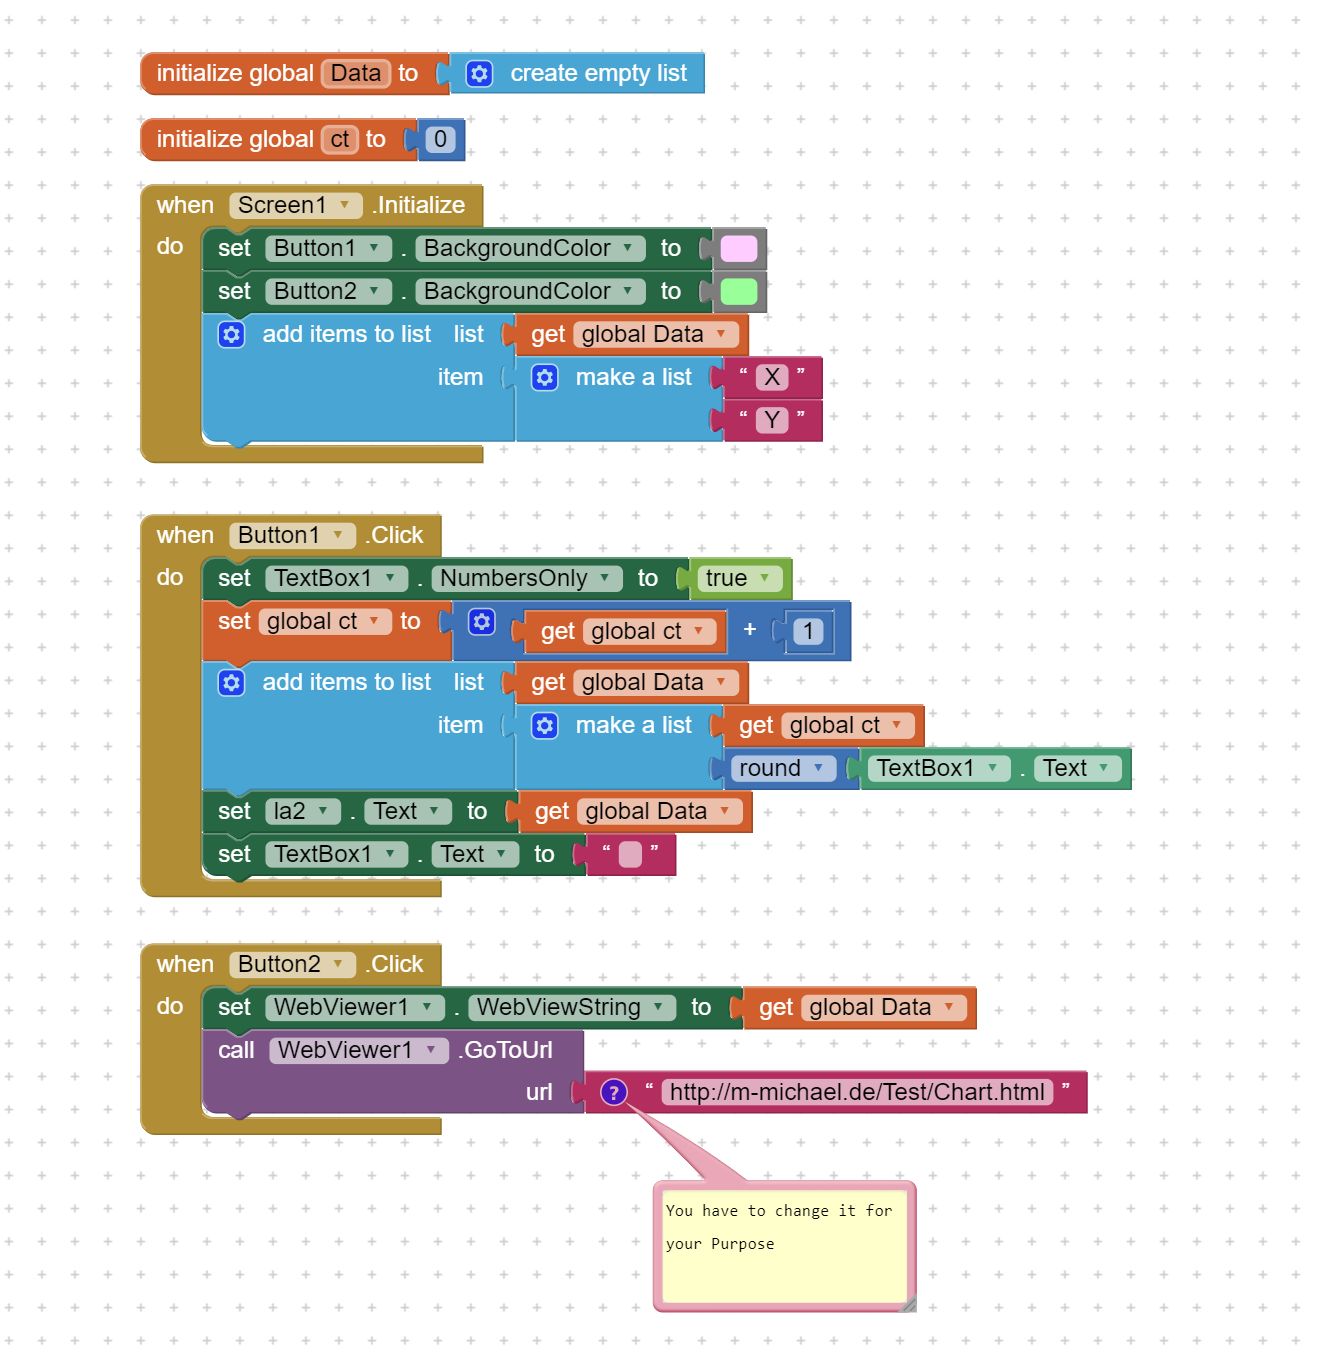
He has already done that in this image
The author of the guide you refer to explains how this works.
You create a list of values in App Inventor, and set this to the webviewstring.
In the html, the webviewstring is returned and set as a variable d
The webviewstring content has to be parsed as JSON to convert it into a javascript array
This array is then used as the dataset to generate the chart
The webviewstring acts as the "messenger" to pass data from the app into the html (you can send data back as well).
Thank you TIMAI2
I got it here https://appinventor.mit.edu/explore/ai2/webview-javascript
1 Like